
Fig. 8
- ID
- ZDB-IMAGE-170315-22
- Publication
- Ye et al., 2015 - Endoderm convergence controls subduction of the myocardial precursors during heart-tube formation
- All Figures
- Figures for Ye et al., 2015
|
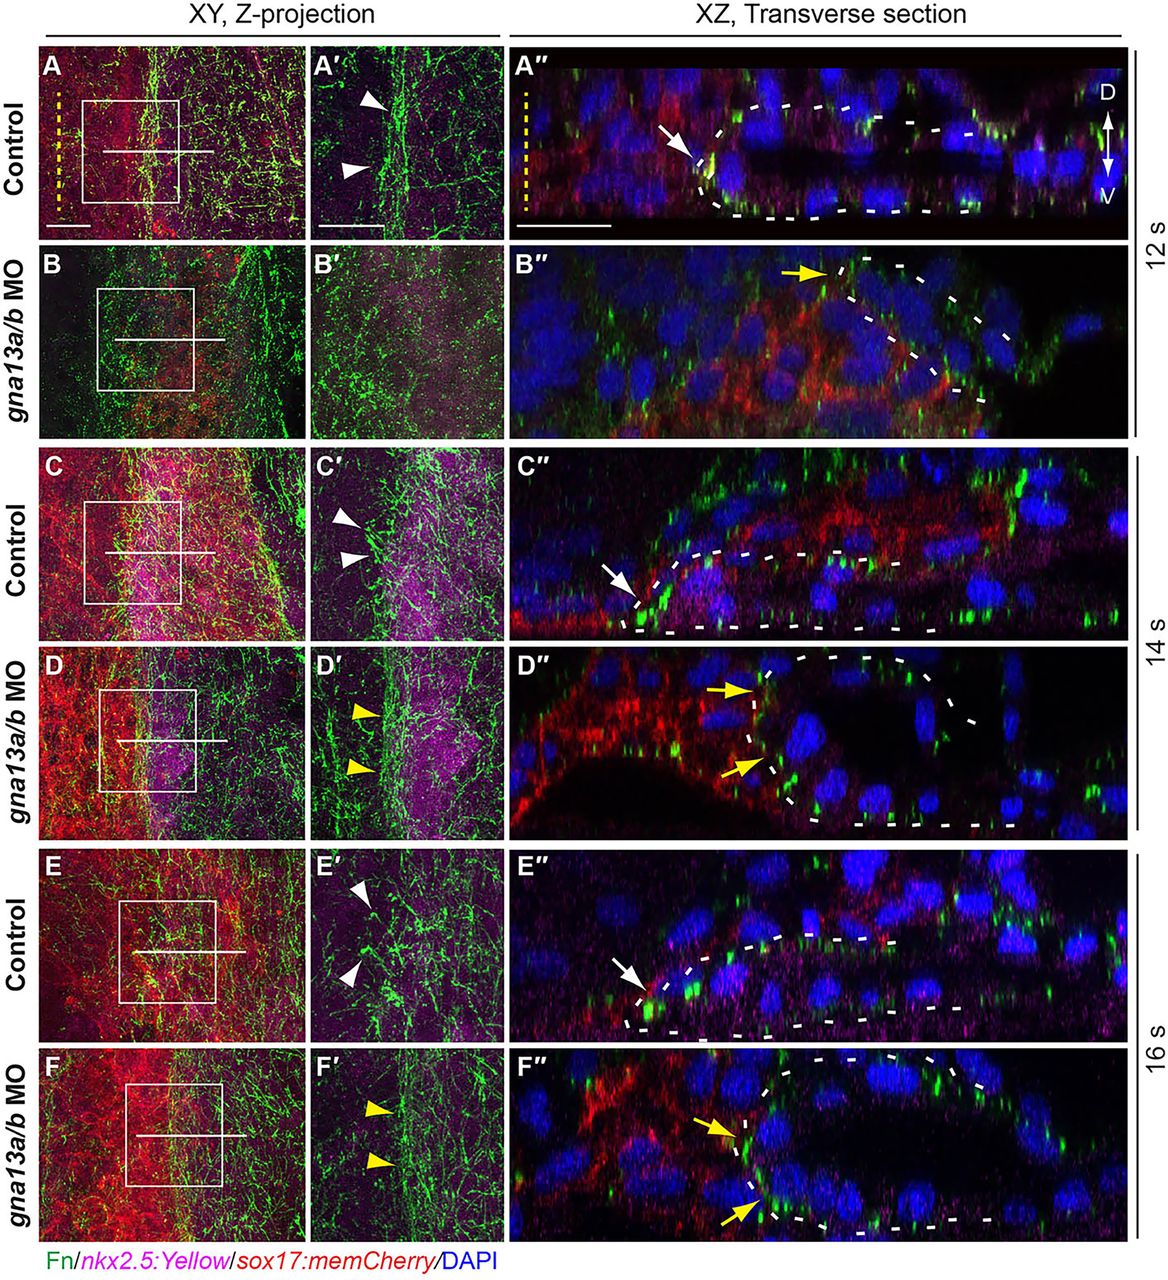
Fig. 8
Fn assembly patterns are disrupted in Gα13 morphants. Whole-mount Fn immunostaining was performed in the embryos indicated. (A-F) Projections of XY views of confocal z-stacks spanning the myocardial cells (magenta), showing Fn assembly (green). (A′-F′) Magnification images of areas shown in boxes in A-F. White and yellow arrowheads indicate leading regions of myocardial populations in control and gna13a/b MO-injected embryos, respectively. (A″-F″) Images of XZ transverse sections of the regions indicated by white lines in A-F. White and yellow arrows indicate Fn assembly in the leading front of myocardial cells in control and gna13a/b MO-injected embryos, respectively. Yellow dashed line, midline; white dashed lines outline myocardial cells; D, dorsal; V, ventral. Scale bars: 20 µm.