
|
Fig. 1
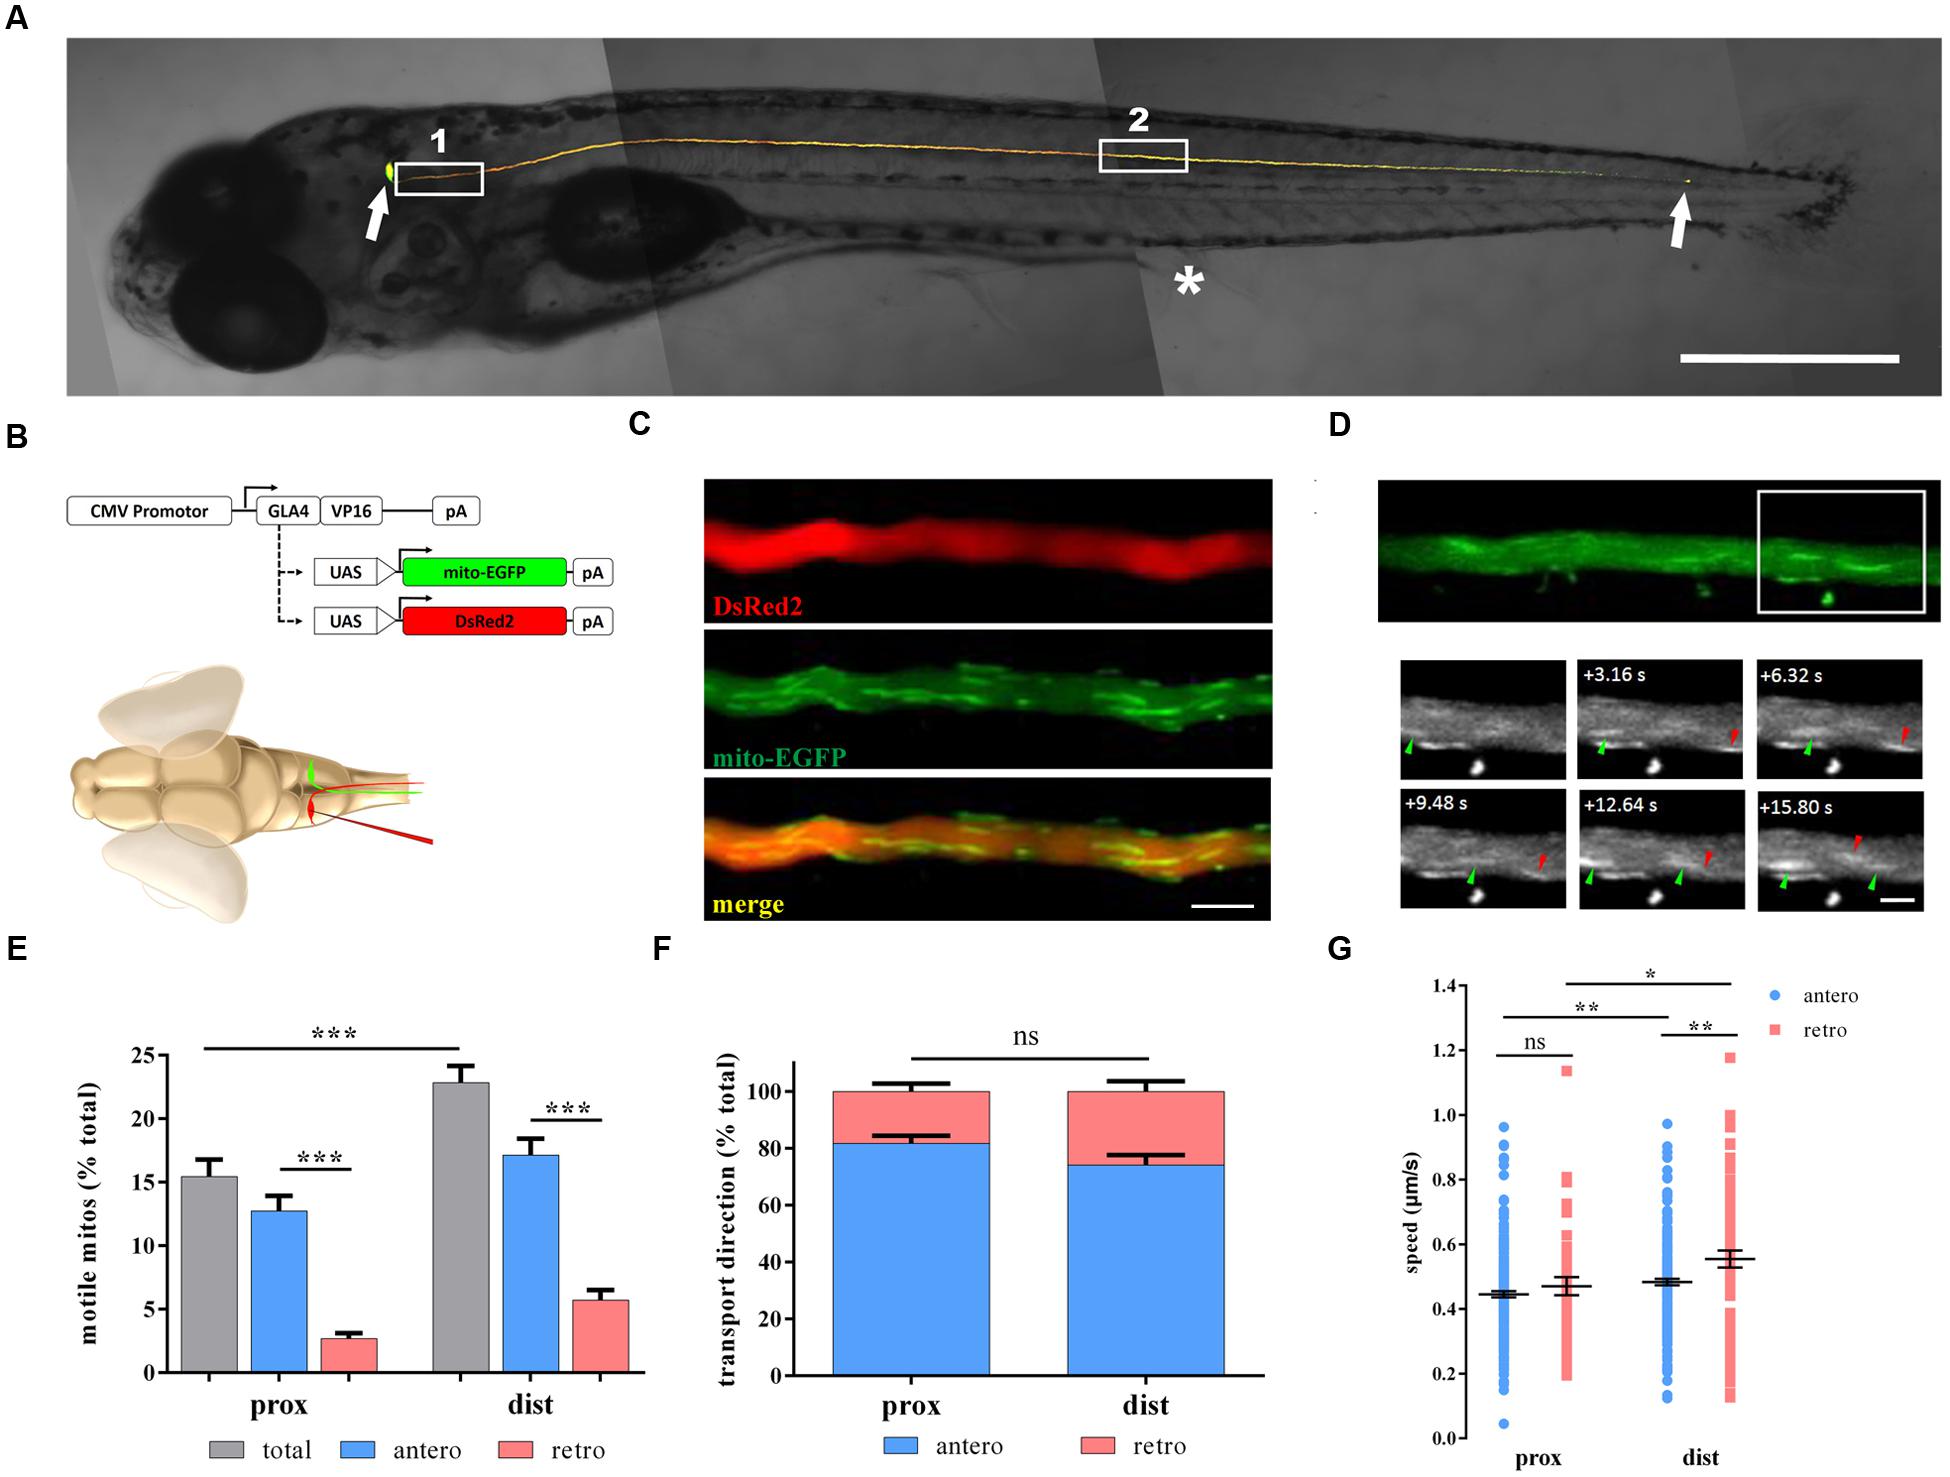
Non-invasive in vivo imaging of mitochondrial transport in zebrafish M cells. (A) M cells of zebrafish larvae were labeled with fluorescent proteins by single-cell electroporation at 6 days post-fertilization (dpf). White arrows indicate the M soma (leftward) and the M axon terminal (rightward). White box 1, proximal axon area; White box 2, distal axon area. Asterisk, cloacal pores. (B) Schematic of constructs used to label M cells (DsRed2) and mitochondria (mito-EGFP) through single-cell electroporation in living zebrafish larvae. (C) The labeled M axon was imaged with a confocal microscope, showing multiple tracts of mitochondria (mito-EGFP, middle) in the axon (DsRed2, top); merged image, bottom. (D) Moving mitochondria were monitored in the axon (area in white box). Arrowheads, moving mitochondria (anterograde, green; retrograde, red). (E–G) Mitochondrial motility (E), transport direction (F; anterograde, blue; retrograde, pink), and speed (G) in axons at 7 dpf. Scale bars: (A) 500 μm, (C) 5 μm, (D) 2.5 μm. ∗p < 0.05, ∗∗p < 0.01, ∗∗∗p < 0.001. Error bars represent SEM.