
|
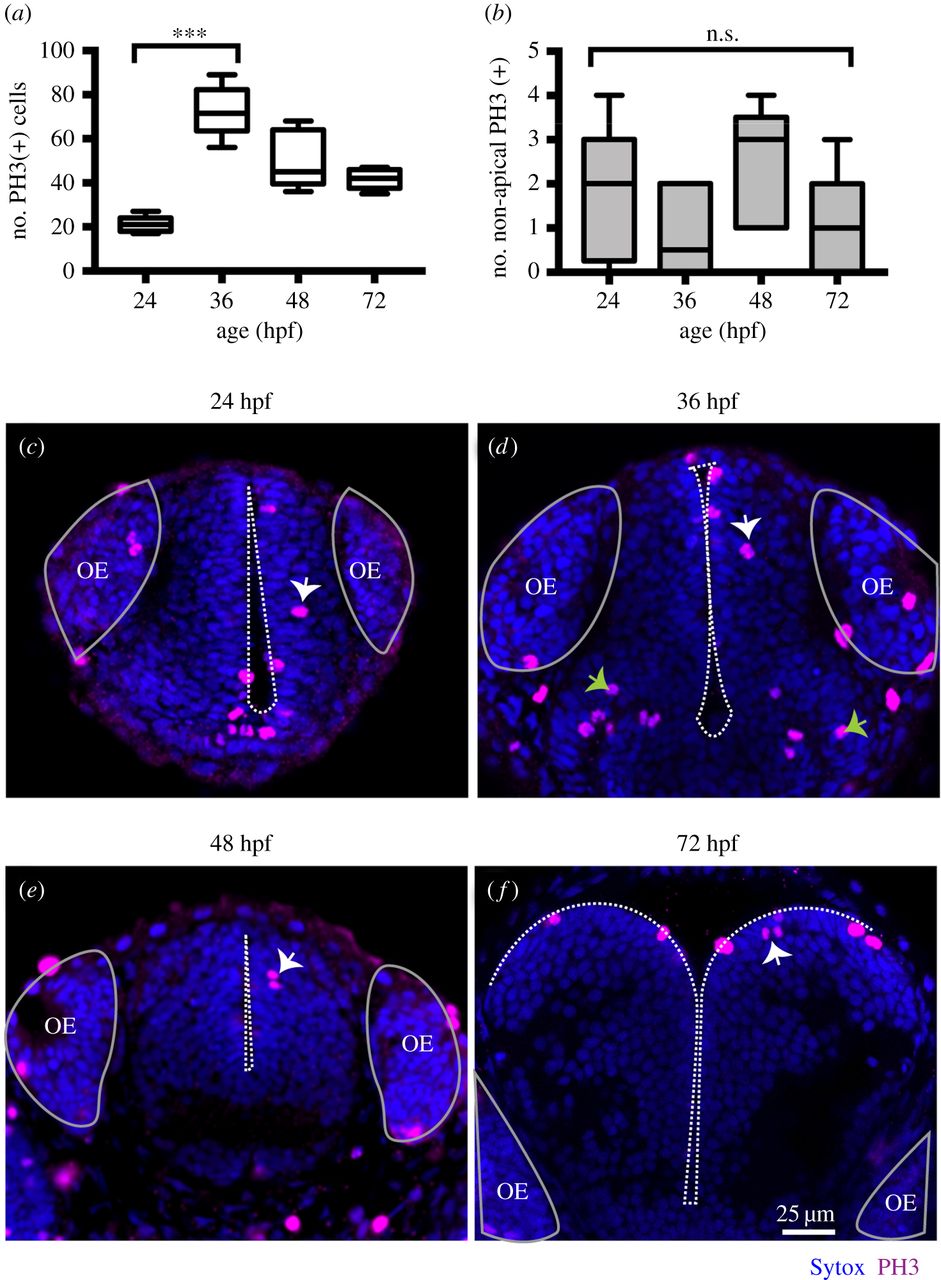
Fig. 3
(a) Quantification of all cells in mitosis in the zebrafish telencephalon at 24, 36, 48, 72 hpf. Data shown as a box-and-whisker plot with the line inside the box representing the mean, and whiskers representing minimum and maximum values. The sample size is indicated in the text. The number of cells in mitosis increases significantly at 36 hpf. Data analysed using Kruskal–Wallis (***p = 0.0004) with Dunn's multiple comparison test (p = 0.0002). (b) Quantification of all cells in mitosis in the zebrafish telencephalon at 24, 36, 48, 72 hpf. Data shown as a box-and-whisker plot with the line inside the box representing the mean and whiskers representing minimum and maximum values. The sample size is indicated in the text. The number of NAP mitoses does not vary significantly from 24 to 72 hpf. Data analysed using Kruskal–Wallis (p = 0.18). (c–f) Neural progenitor mitoses revealed by PH3 staining (magenta, indicated by white arrows) in non-apical locations of zebrafish telencephalon at (c) 24 hpf, (d) 36 hpf, (e) 48 hpf, (f) 72 hpf. Tissue is counterstained with nuclei marker (Sytox, in blue). Images are single z-slices of a transverse view of zebrafish telencephalon at (c) 24 hpf, (d) 36 hpf, (e) 48 hpf, (f) 72 hpf. Green arrows in (d) indicate clusters of mitoses in hypothalamic territory that were not analysed. A white dash line outlines apical surface or ventricle of zebrafish telencephalon. OE, olfactory epithelium.