
|
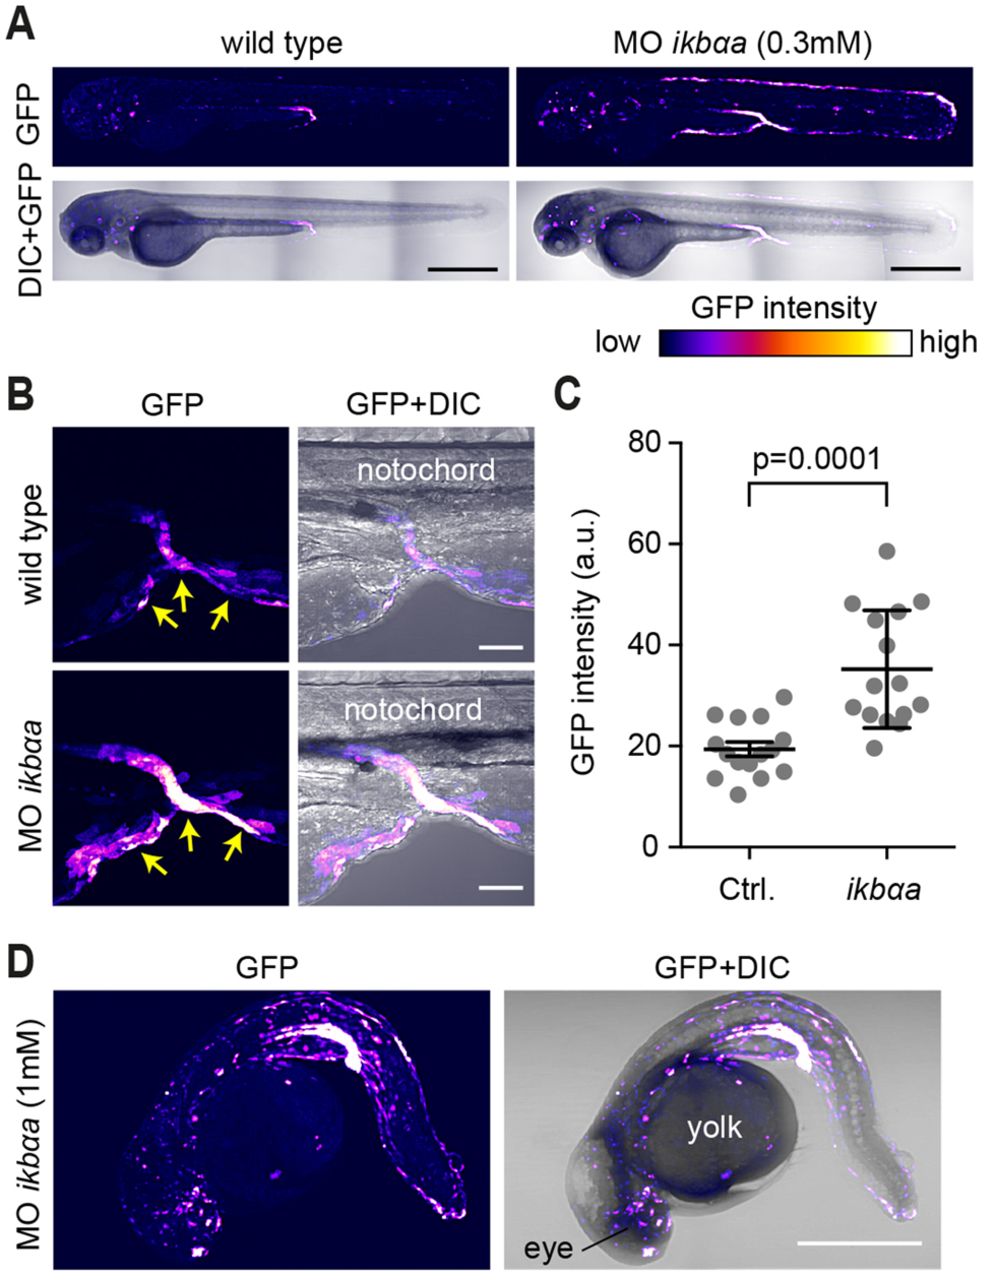
Fig. 5
Specificity of Tg(8xHs.NFκB:GFP,Luciferase) for NF-κB activity in zebrafish embryos. (A,B) 0.3 mM iκbαa morpholino was injected into transgenic embryos. Morphants at 3 dpf had increased expression of GFP in the skin (A) and proctodeum (B, arrows). GFP fluorescence is shown as a false-color heat map. The intensity of the laser was equal for both images to allow direct comparison of the GFP signal in morphants and controls. (C) Quantitative comparison of the GFP signal in the proctodeum of embryos injected with 0.3 mM standard control or iκbαa morpholino. Each dot represents an individual embryo at 2 dpf (mean±s.d.). (D) Injection of 1 mM iκbαa morpholino results in higher GFP expression and embryonic malformation. GFP fluorescence is shown as a heat map as indicated in A. Scale bars: 500 µm (A); 50 µm (B); 300 µm (D).