
|
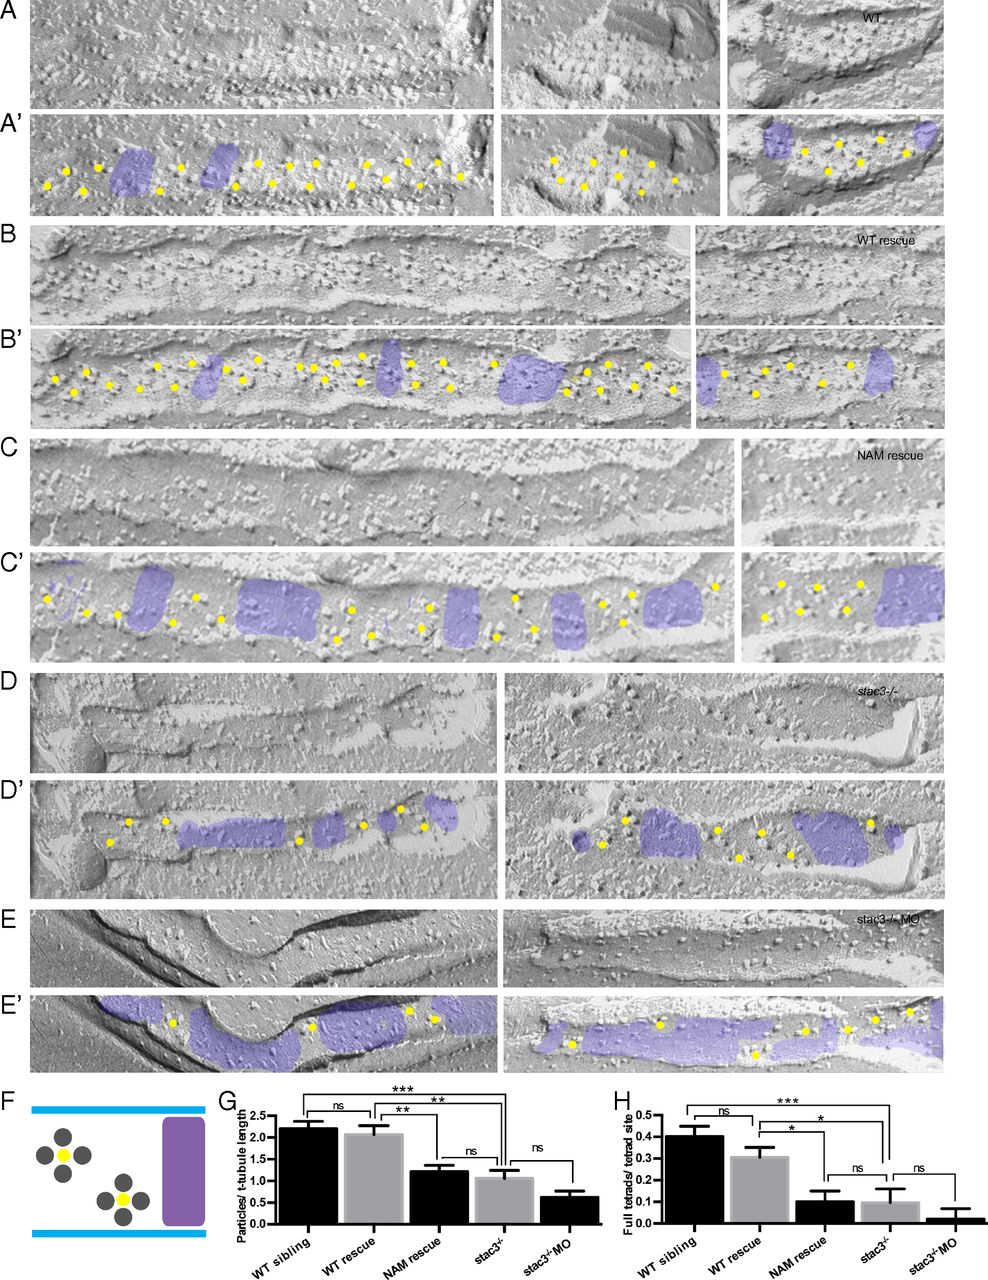
Fig. 2
DHPR tetrads are reduced and incomplete in stac3 mutants. (A–E) Freeze-fracture electron micrographs of 4-d postfertilization larvae showing DHPR particles in triadic clusters of WT (A), stac3−/− expressing stac3WT-EGFP (WT rescue) (B), stac3−/− expressing stac3NAM-mKate2 (NAM rescue) (C), stac3−/− (D), and stac3−/− injected with an antisense morpholino oligonucleotide against stac3 (stac3−/− + MO) (E). (A′–E′) Same as A–E, with yellow dots and purple shading added for clarity to denote, respectively, segments of T tubules with tetrad sites of DHPRs and segments of T tubules with no tetrad sites in muscle fibers of WT (A′), WT rescue (B′), NAM rescue (C′), stac3−/− (D′), and stac3−/− + MO (E′). (F) Illustration showing stereotypical DHPR particles in tetrad sites (labeled with yellow dots) along a T tubule and gaps with no tetrad sites (purple) as seen above. (G) Histogram showing that the particles per T-tubule length are decreased in NAM rescue, stac3−/−, and stac3−/− + MO muscles compared with WT and WT rescue. (ANOVA Tukey's; ***P < 0.001, **P < 0.01.) (H) Histogram showing that full tetrads per tetrad site are decreased in NAM rescue, stac3−/−, and stac3−/− + MO muscles compared with WT and WT rescue. ns, not significant. SEMs are indicated. (ANOVA Tukey's; ***P < 0.001, *P < 0.05.)