
IMAGE
Fig. 2
- ID
- ZDB-IMAGE-170222-111
- Publication
- Park et al., 2016 - Ginsenoside Re Inhibits Osteoclast Differentiation in Mouse Bone Marrow-Derived Macrophages and Zebrafish Scale Model
- All Figures
- Figures for Park et al., 2016
Image
|
Figure Caption
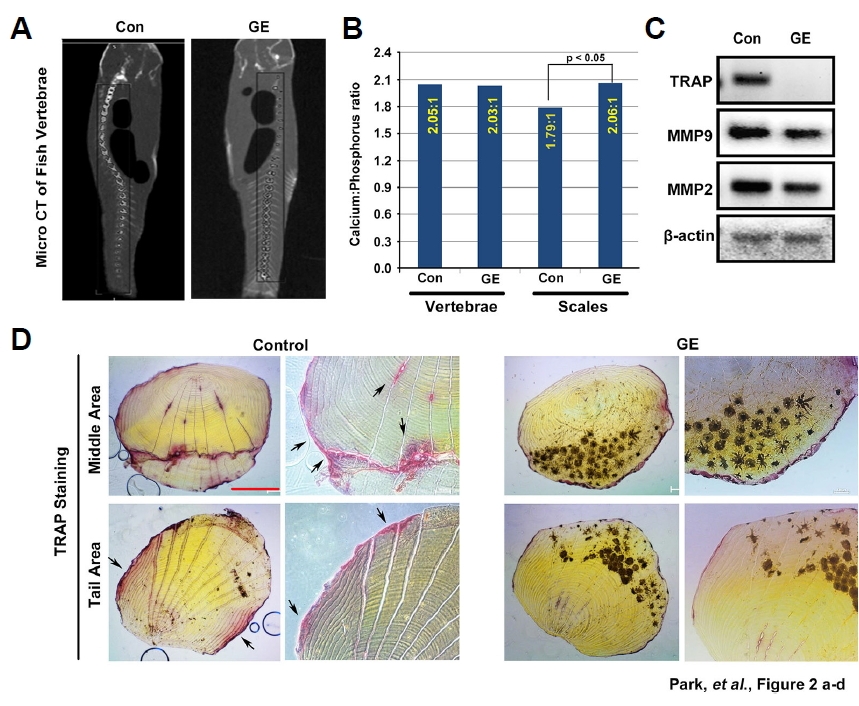
Fig. 2
Effect of aqueous ginseng extract on osteoporosis in the zebrafish scale model. (A) After treatment with aqueous ginseng extract (GE, 10 μg/ml) for 35 days, zebrafish were scanned by μ-CT to visualize vertebrae density. (B) Calcium/phosphorous ratios were measured in vertebrae and scales from zebrafish samples by inductively coupled plasma mass spectrometry. (C) RT-PCR was performed to determine the mRNA expression levels of osteoclast marker genes
Acknowledgments
This image is the copyrighted work of the attributed author or publisher, and
ZFIN has permission only to display this image to its users.
Additional permissions should be obtained from the applicable author or publisher of the image.
Full text @ Mol. Cells