
Fig. 1
- ID
- ZDB-IMAGE-170222-100
- Antibodies
- Publication
- Linsley et al., 2017 - Congenital myopathy results from misregulation of a muscle Ca2+ channel by mutant Stac3
- All Figures
- Figures for Linsley et al., 2017
|
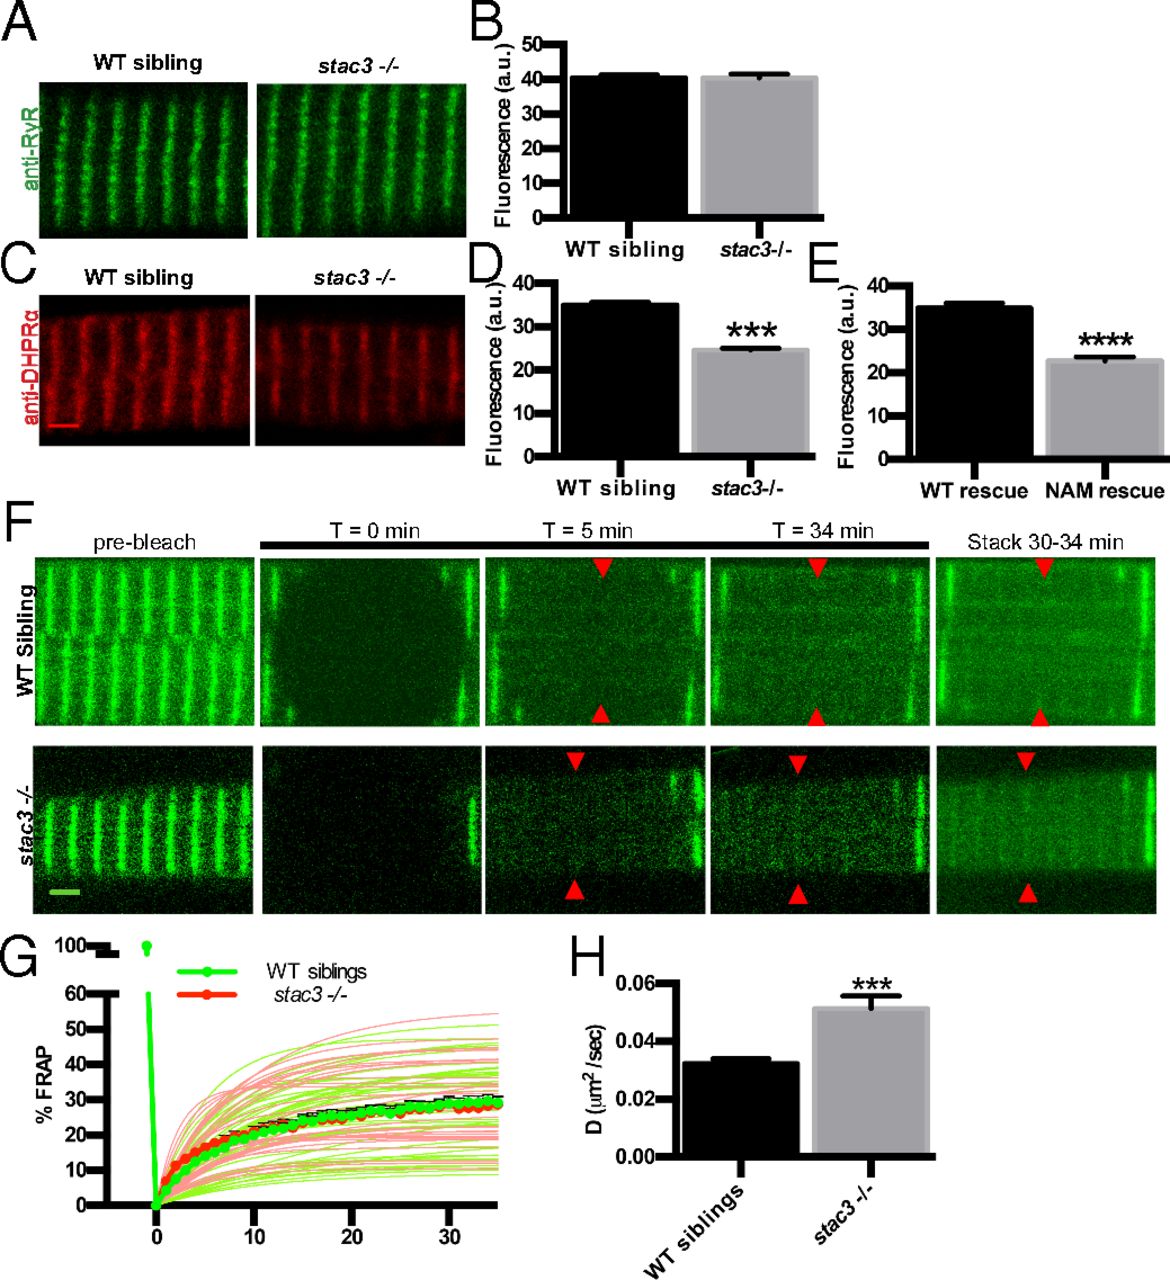
Fig. 1
DHPRα1 but not RyR1 is reduced in T-tubule striations of stac3 mutants. (A) Immunofluorescence labeling of WT sibling and stac3−/− disassociated myotubes with anti-pan RyR (34c). (B) Mean immunofluorescence intensity of anti-RyR in stac3−/− compared with WT siblings showing no difference in triadic RyR (t test, P = 0.89, n = 85 WT sibling, n = 50 stac3−/−). a.u., arbitrary units. (C) Immunofluorescence labeling of WT sibling and stac3−/− disassociated myotubes with mAb1 1A against a cytoplasmic region of DHPRα1S (15). (D) Mean mAb1 1A labeling in WT siblings and stac3−/− showing a decrease in triadic DHPRα1S (t test, ***P < 0.0001, n = 216 WT sibling, n = 264 stac3−/−). (E) Quantification of the mean of immunofluorescence labeling of anti-DHPRα1S in stac3−/− expressing stac3NAM (NAM rescue) at triads compared with stac3−/− expressing stac3WT (WT rescue) (n = 75 stac3−/−; stac3WT, n = 53 stac3−/−; stac3NAM, t test, ****P < 0.0001). (F) Time course for FRAP of EGFP-DHPRα1S expressed in WT siblings and stac3−/− myofibers. Shown are EGFP-DHPRα1S before (prebleach), after photobleaching (T = 0, 5, 34 min), and a maximum projection (stack) of T = 30 to 34 min (Right). (G) Mean quantification of the time course of FRAP in WT siblings (thick green line and circles) and stac3−/− (thick red line and circles). Thin lines represent nonlinear regressions from individual traces of FRAPs from WT siblings (green) and stac3−/− (red). The vertical thick green line depicts bleaching. (H) Histogram showing that the diffusion rate (D) of EGFP-DHPRα1S is higher in stac3−/− (t test, ***P < 0.0001, n = 33 stac3−/−, n = 45 WT siblings). SEMs are indicated. (Scale bars, 2 μm.)