
Fig. 3
- ID
- ZDB-IMAGE-170206-3
- Genes
- Publication
- Stratman et al., 2017 - Mural-Endothelial cell-cell interactions stabilize the developing zebrafish dorsal aorta
- All Figures
- Figures for Stratman et al., 2017
|
Fig. 3
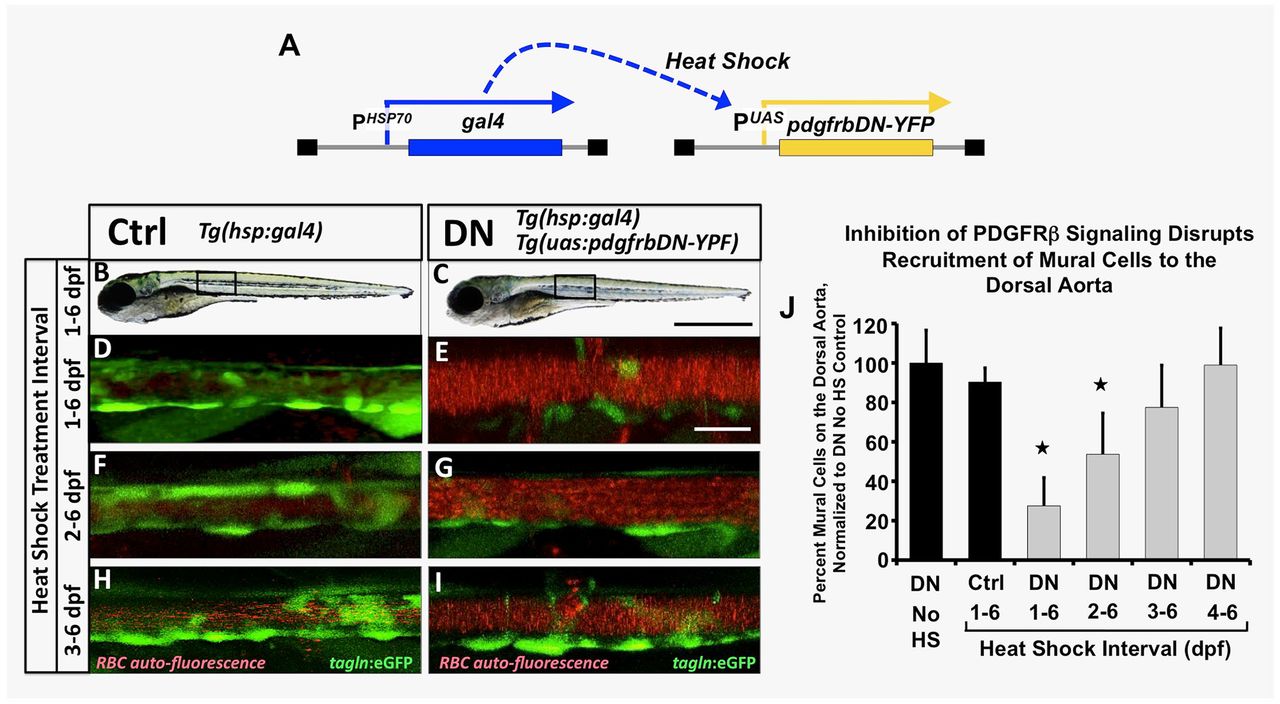
Inhibition of pdgfr signaling leads to loss of mural cell coverage on the dorsal aorta. (A) Schematic diagram showing the Tg(HSP70:gal4 and UAS:pdgfrbDN-YFP) double transgenes used for heat shock-inducible expression of pdgfrbDN. These fish were outcrossed to Tg(tagln:egfp) transgenic fish to generate triple heterozygotes, heat shocked daily for the indicated time frame and imaged for analysis of mural cell coverage at 6 dpf. (B-I) Representative confocal images of 6 dpf heat shocked Tg(tagln:egfp), Tg(HSP70:gal4) control (Ctrl, B,D,F,H) or Tg(tagln:egfp), Tg(HSP70:gal4), Tg(UAS:pdgfrbDN-YFP) dominant negative-expressing (DN, C,E,G,I) animals are shown. Fish were heat shocked daily from 1-6 dpf (B-E), 2-6 dpf (F-G) or 3-6 dpf (H-I) and then imaged at 6 dpf. The tagln/sm22+ vSMCs associated with the dorsal aorta are shown in green; red blood cell autofluorescence showing the vascular compartment is in red. (J) Quantification of the number of vSMCs covering the dorsal aorta following the indicated heat shock interval. Tg(tagln:egfp), Tg(HSP70:gal4), Tg(UAS:pdgfrbDN-YFP) heat shock-inducible dominant negative PDGFRB (DN) or Tg(tagln:egfp), Tg(HSP70:gal4) control (Ctrl) fish were heat shocked as indicated, imaged at 6 dpf and the number of tagln/sm22+ cells per 3-somite segment length of dorsal aorta counted. Values were normalized to the tagln/sm22+ cell counts from non-heat shocked DN fish. Values are mean±s.e.m.; *P≤0.05 significance compared with non-heat shocked DN fish. Data are presented from a single experiment of n=5 fish; two experimental replicates for 2, 3, 4 day HS experiments and four experimental replicates from 1-6 day HS were carried out as validation showing consistent results. In more absolute values, we typically see approximately 20 vSMCs recruit to a 3-somite segment of dorsal aorta under control conditions, and ∼7-8 vSMCs recruit to a 3-somite length of dorsal aorta under DN activation conditions. Scale bars:1 mm (B,C) and 50 µm (D-I).