
Fig. S9
- ID
- ZDB-IMAGE-170201-20
- Publication
- Rydeen et al., 2016 - Cyp26 Enzymes Facilitate Second Heart Field Progenitor Addition and Maintenance of Ventricular Integrity
- All Figures
- Figures for Rydeen et al., 2016
|
Fig. S9
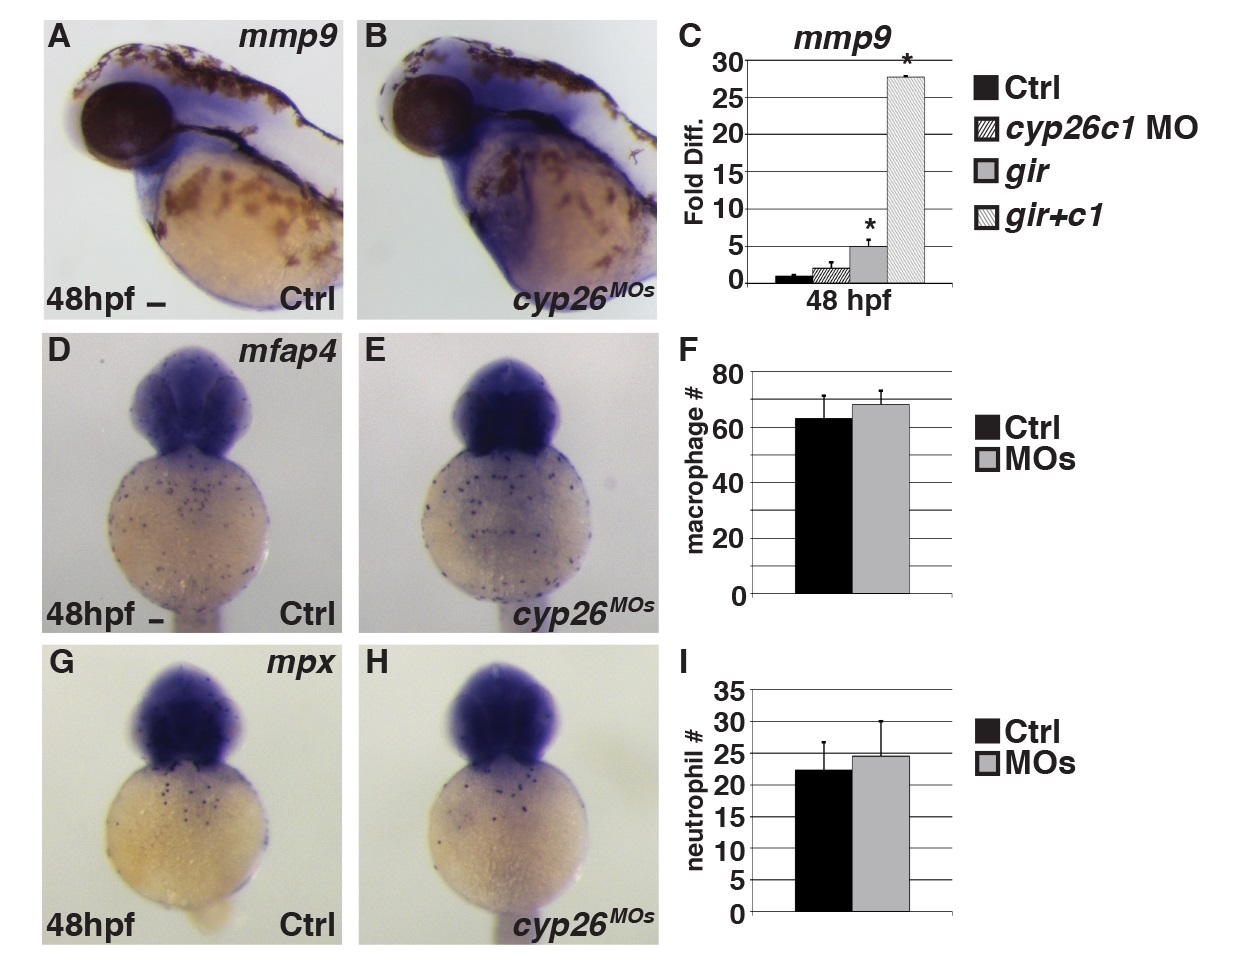
Increased mmp9 expression in Cyp26-deficient embryos is not due to an increase in macrophage and neutrophil numbers.
(A,B) ISH of mmp9 in control and Cyp26-deficient embryos at 48 hpf. (C) RT-qPCR of mmp9 expression in control, Cyp26c1-depleted, gir mutant, and gir+c1 embryos. (D,E) ISH of mfap4 in control and Cyp26-deficient embryos at 48 hpf. (F) Graph depicting quantification of average macrophage number over the yolk sac (n = 15 per group). (G,H) ISH of mpx in control and Cyp26-deficient at 48 hpf. (I) Graph depicting the average number of neutrophils over the yolk sac (n = 10 per group). Error bars are SEM. Lateral view, anterior left (A,B), frontal view, anterior up (D,E,G,H); n>20 embryos per group (A,B,D,E,G,H). Scale bars: 50 mm.