
Fig. S7
- ID
- ZDB-IMAGE-170201-18
- Publication
- Rydeen et al., 2016 - Cyp26 Enzymes Facilitate Second Heart Field Progenitor Addition and Maintenance of Ventricular Integrity
- All Figures
- Figures for Rydeen et al., 2016
|
Fig. S7
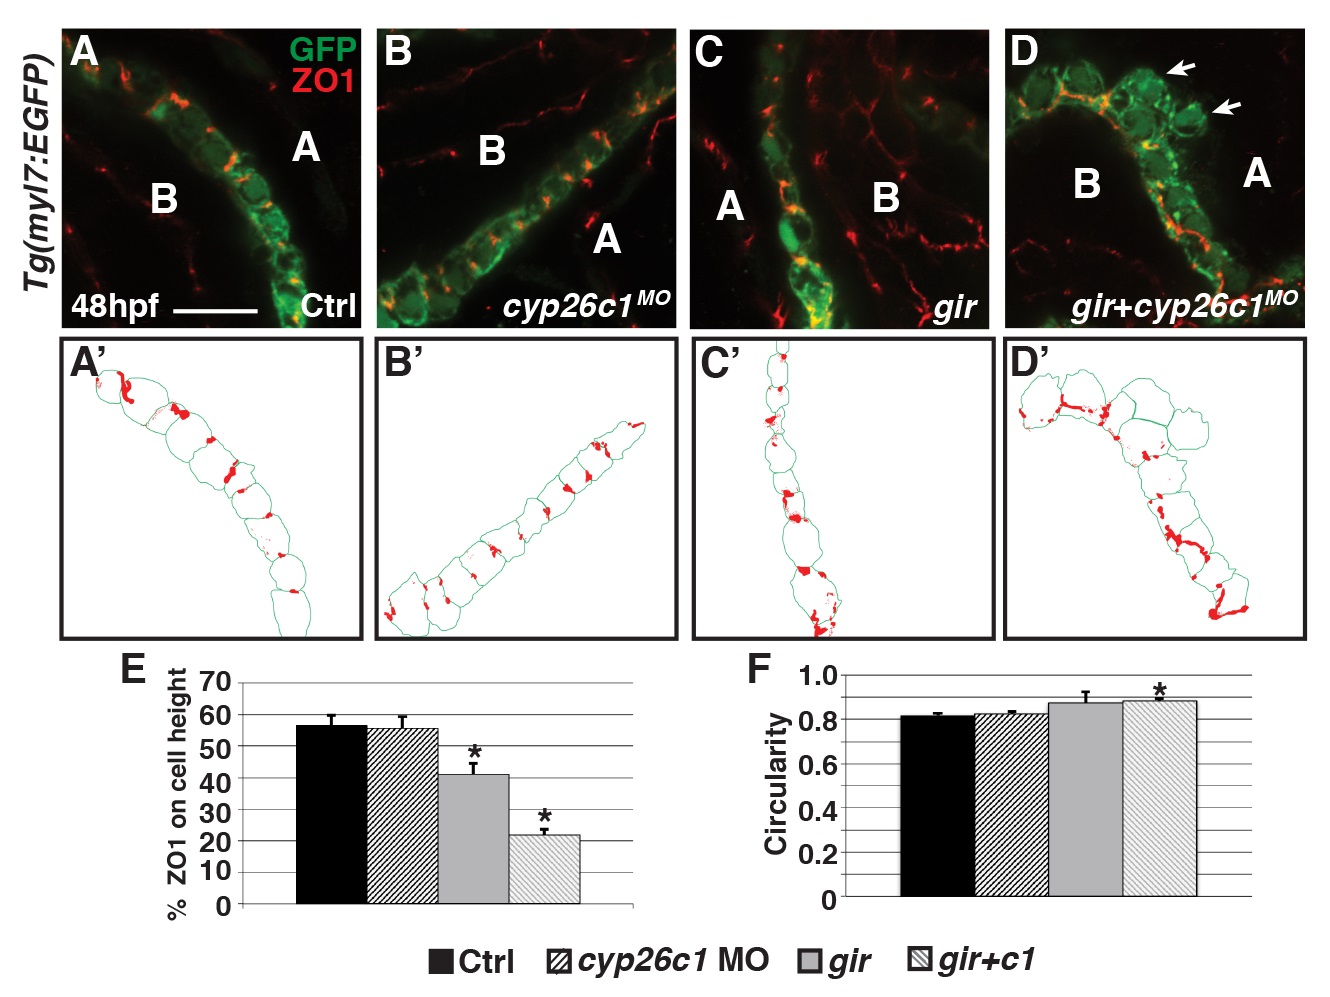
Gir mutants and gir+c1 embryos have disrupted polarity and cell shape.
(A-D) Confocal images of IHC of control, Cyp26c1-depleted, gir mutant, and gir+c1 Tg(myl7:EGFP) stained for ZO1 (red), and GFP (green). (A’-D’) Schematized outlines of cell boundaries and ZO1 staining for images in A-D. Arrows denotes cardiomyocytes protruding into the pericardial space. (E) Graph depicting the percentage of ZO1 expression along the height of cardiomyocytes (n = 36 for each group). (F) Graph depicting circularity measurement of ventricular cells (n = 36 for each group). Error bars are SEM, asterisks denote p<0.05 by Student’s t-test. Lateral views, anterior right (A-D). A, apical; B, basal. Scale bar: 50 mm.