
Fig. 5
- ID
- ZDB-IMAGE-170131-4
- Publication
- Zhou et al., 2016 - PEG-b-PCL polymeric nano-micelle inhibits vascular angiogenesis by activating p53-dependent apoptosis in zebrafish.
- All Figures
- Figures for Zhou et al., 2016
|
Fig. 5
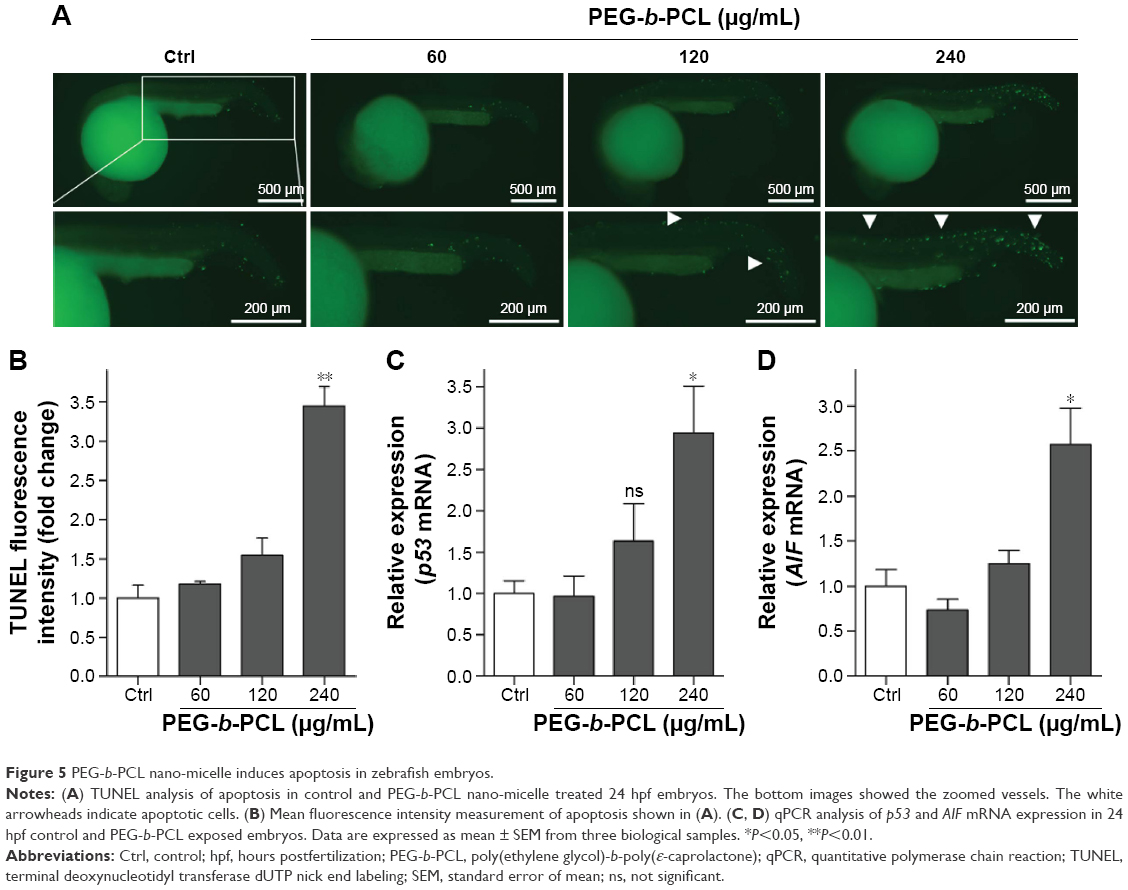
Figure 5 PEG-b-PCL nano-micelle induces apoptosis in zebrafish embryos.
Notes: (A) TUNEL analysis of apoptosis in control and PEG-b-PCL nano-micelle treated 24 hpf embryos. The bottom images showed the zoomed vessels. The white arrowheads indicate apoptotic cells. (B) Mean fluorescence intensity measurement of apoptosis shown in (A). (C, D) qPCR analysis of p53 and AIF mRNA expression in 24 hpf control and PEG-b-PCL exposed embryos. Data are expressed as mean ± SEM from three biological samples. *P<0.05, **P<0.01.
Abbreviations: Ctrl, control; hpf, hours postfertilization; PEG-b-PCL, poly(ethylene glycol)-b-poly(ε-caprolactone); qPCR, quantitative polymerase chain reaction; TUNEL, terminal deoxynucleotidyl transferase dUTP nick end labeling; SEM, standard error of mean; ns, not significant.