
Fig. 4
- ID
- ZDB-IMAGE-170131-3
- Publication
- Zhou et al., 2016 - PEG-b-PCL polymeric nano-micelle inhibits vascular angiogenesis by activating p53-dependent apoptosis in zebrafish.
- All Figures
- Figures for Zhou et al., 2016
|
Fig. 4
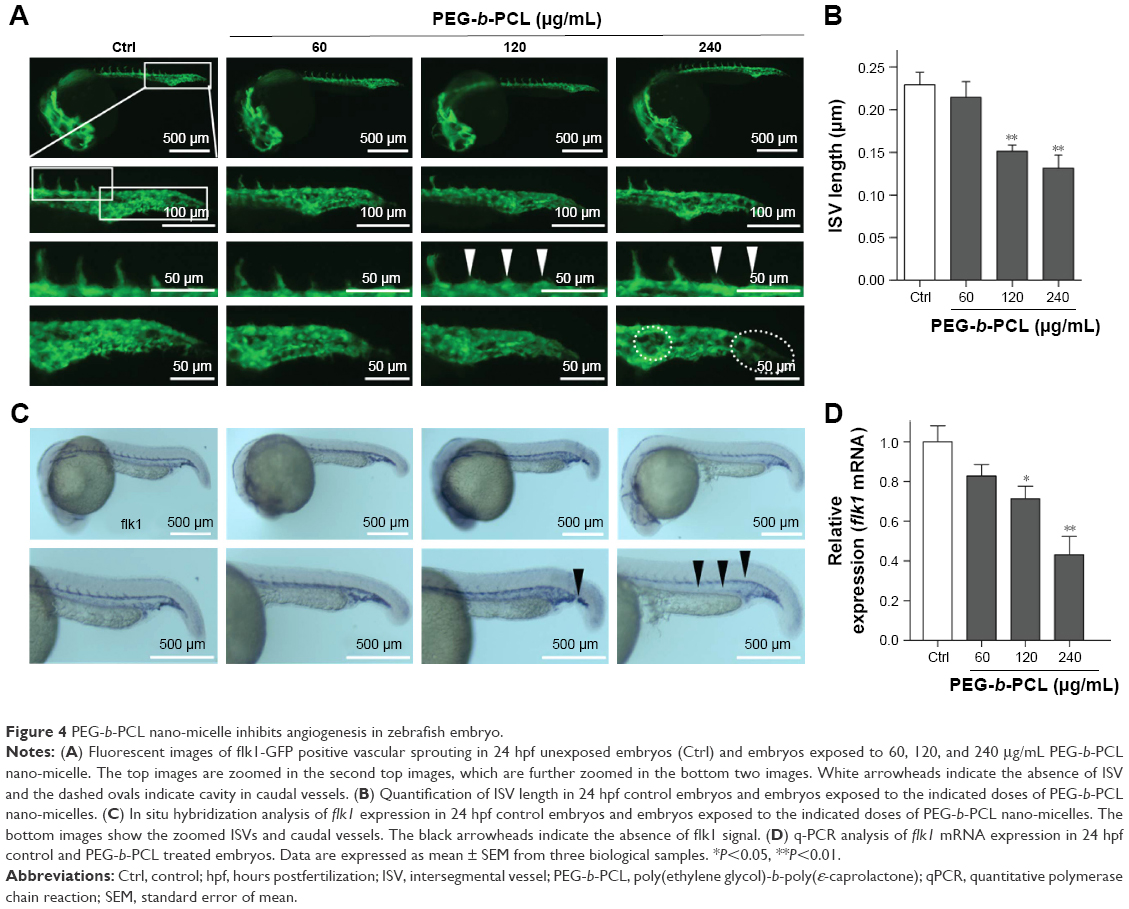
Figure 4 PEG-b-PCL nano-micelle inhibits angiogenesis in zebrafish embryo.
Notes: (A) Fluorescent images of flk1-GFP positive vascular sprouting in 24 hpf unexposed embryos (Ctrl) and embryos exposed to 60, 120, and 240 μg/mL PEG-b-PCL nano-micelle. The top images are zoomed in the second top images, which are further zoomed in the bottom two images. White arrowheads indicate the absence of ISV and the dashed ovals indicate cavity in caudal vessels. (B) Quantification of ISV length in 24 hpf control embryos and embryos exposed to the indicated doses of PEG-b-PCL nano-micelles. (C) In situ hybridization analysis of flk1 expression in 24 hpf control embryos and embryos exposed to the indicated doses of PEG-b-PCL nano-micelles. The bottom images show the zoomed ISVs and caudal vessels. The black arrowheads indicate the absence of flk1 signal. (D) q-PCR analysis of flk1 mRNA expression in 24 hpf control and PEG-b-PCL treated embryos. Data are expressed as mean ± SEM from three biological samples. *P<0.05, **P<0.01.
Abbreviations: Ctrl, control; hpf, hours postfertilization; ISV, intersegmental vessel; PEG-b-PCL, poly(ethylene glycol)-b-poly(ε-caprolactone); qPCR, quantitative polymerase chain reaction; SEM, standard error of mean.