
IMAGE
Fig. S5
- ID
- ZDB-IMAGE-170123-36
- Publication
- Drummond et al., 2017 - The tbx2a/b transcription factors direct pronephros segmentation and corpuscle of Stannius formation in zebrafish
- All Figures
- Figures for Drummond et al., 2017
Image
|
Figure Caption
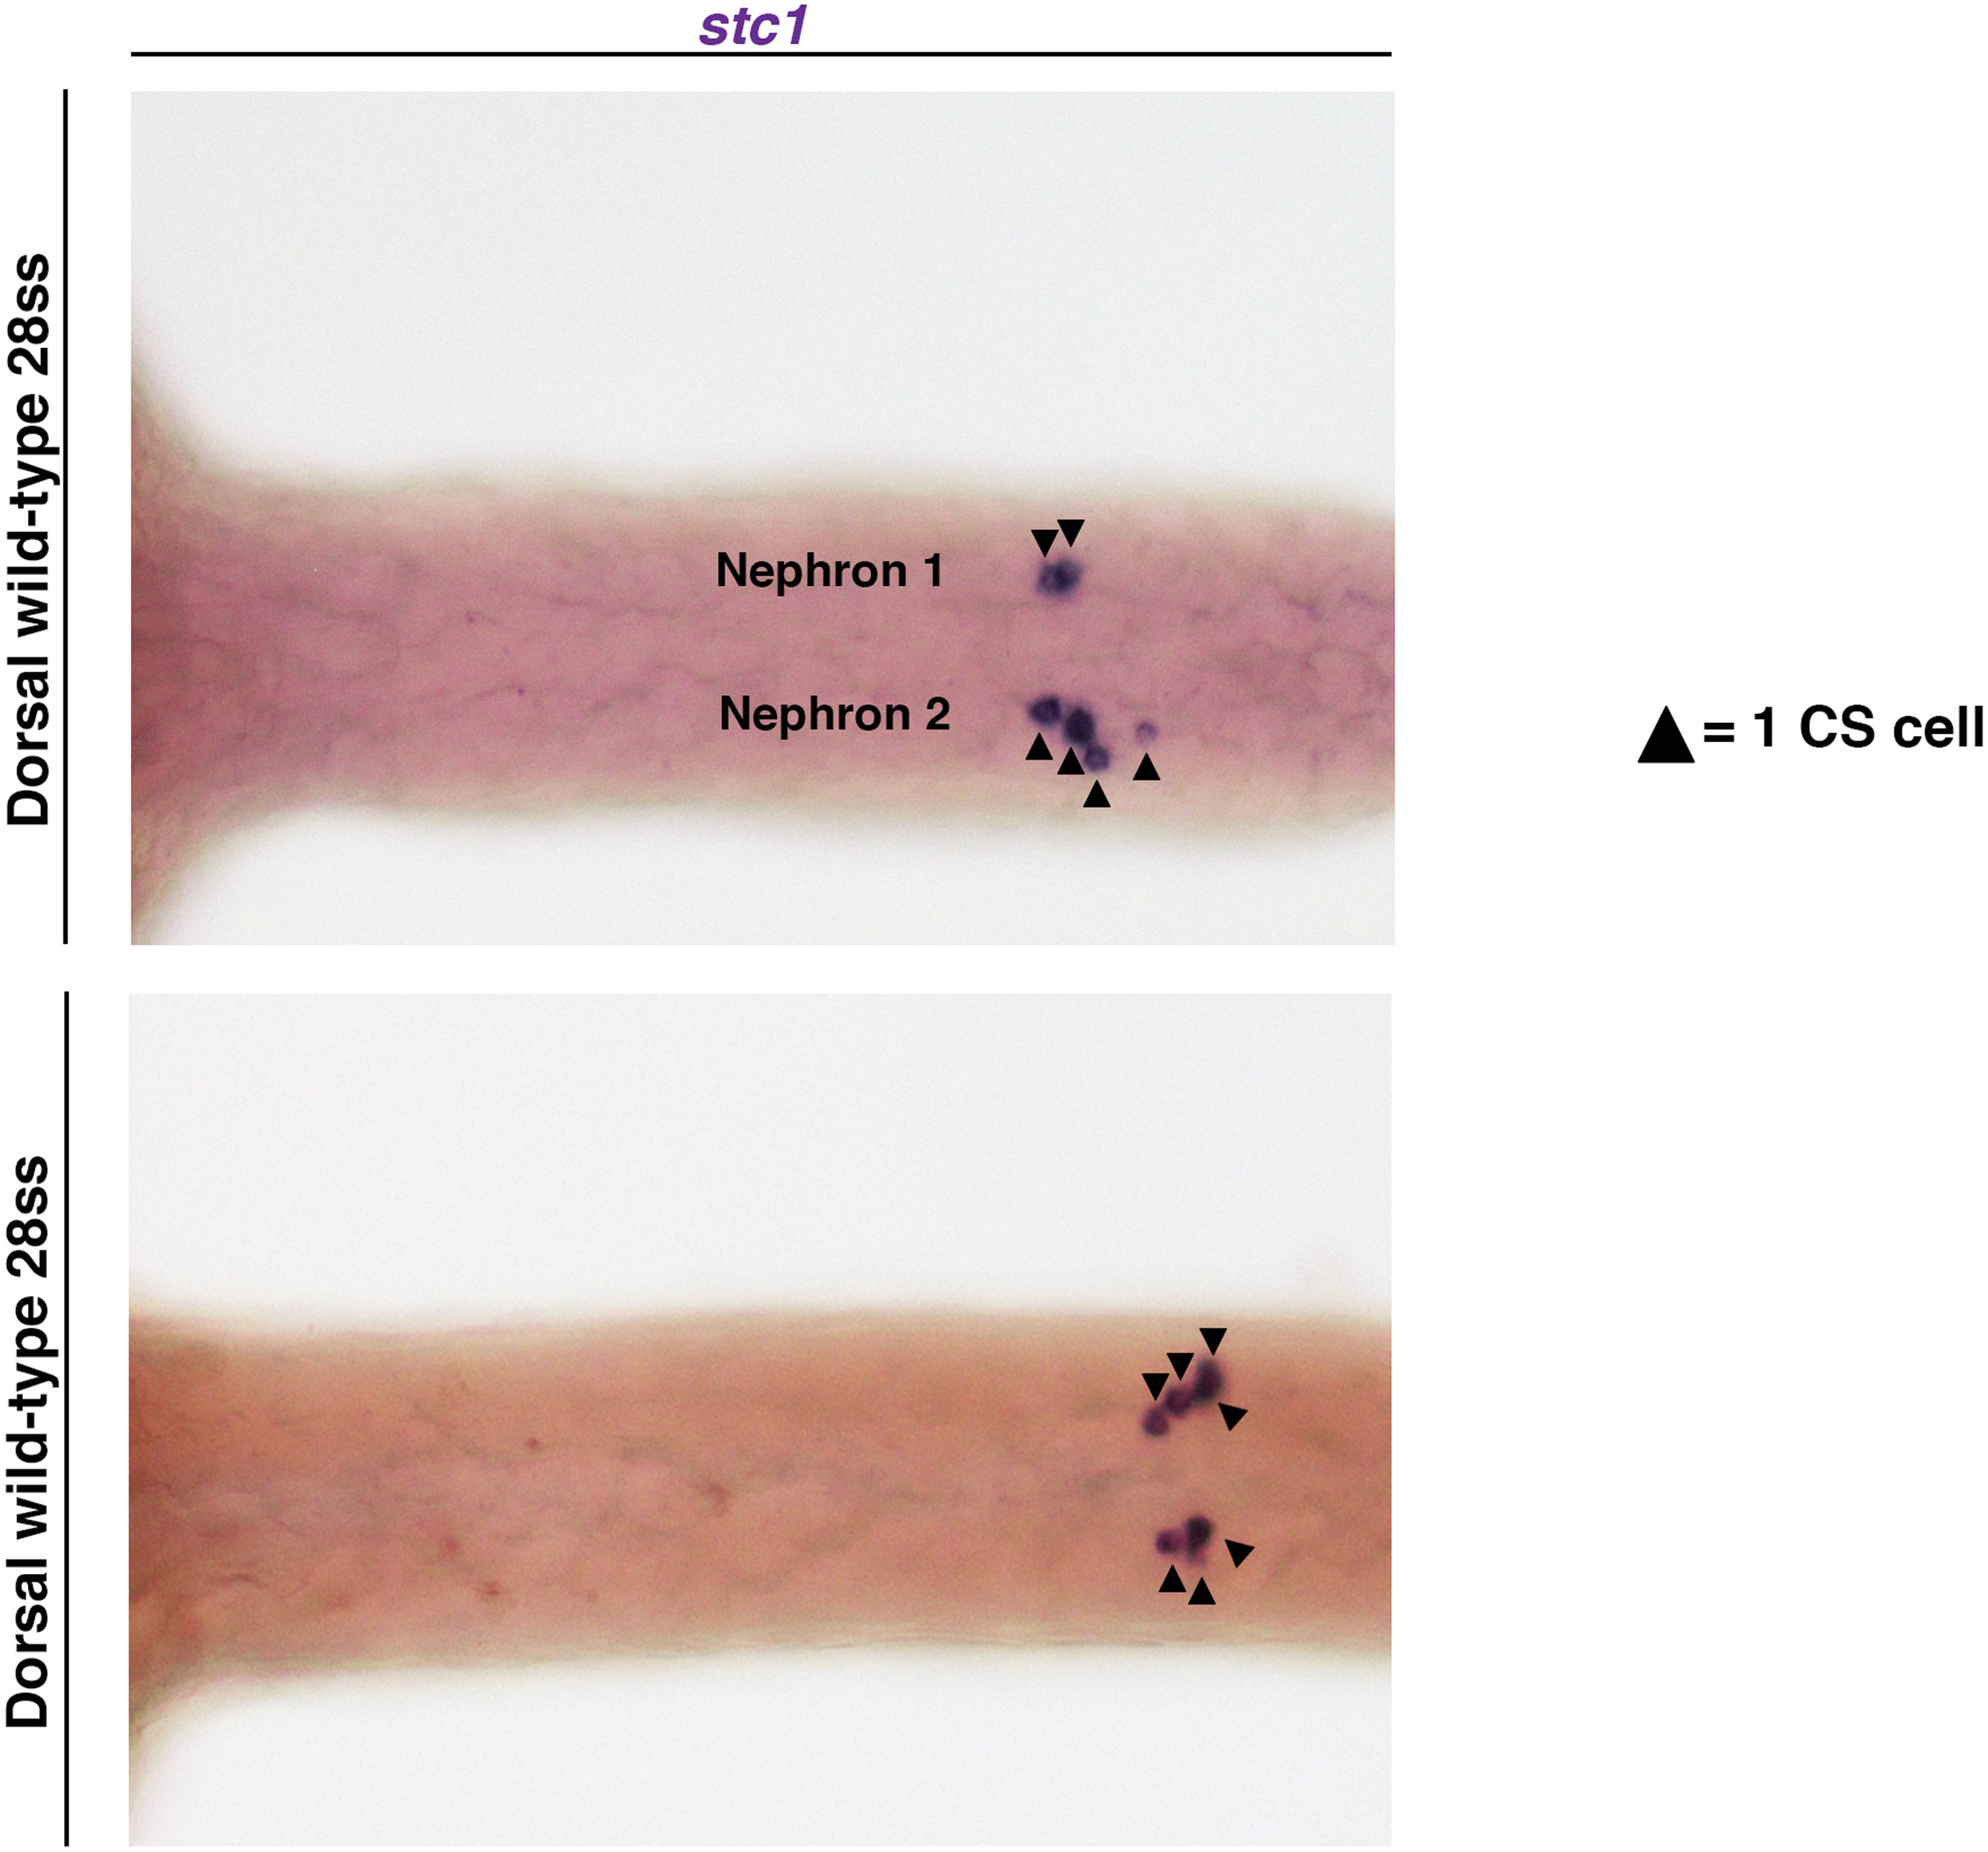
Fig. S5
CS cell counting technique. (A) Wild-type 28 ss embryos were used to exemplify how CS cells were counted. Whole mount in situ hybridization was performed using stc1 or sim1a probes to label the CS cells. Embryos were then mounted dorsally in glycerol. On average, each nephron is composed of 4–6 cells per nephron. A black arrowhead indicates the location of each CS cell. (Top) The embryo has 2 cells in the first nephron, and 4 cells in the second nephron. (Bottom) Embryo two has 4 cells in the first nephron and three cells in the second nephron.
Acknowledgments
This image is the copyrighted work of the attributed author or publisher, and
ZFIN has permission only to display this image to its users.
Additional permissions should be obtained from the applicable author or publisher of the image.
Reprinted from Developmental Biology, 421(1), Drummond, B.E., Li, Y., Marra, A.N., Cheng, C.N., Wingert, R.A., The tbx2a/b transcription factors direct pronephros segmentation and corpuscle of Stannius formation in zebrafish, 52-66, Copyright (2017) with permission from Elsevier. Full text @ Dev. Biol.