IMAGE

Fig. 5

ID
ZDB-IMAGE-170118-5
Source
Figures for Zhou et al., 2016
Image
Figure Caption

Fig. 5

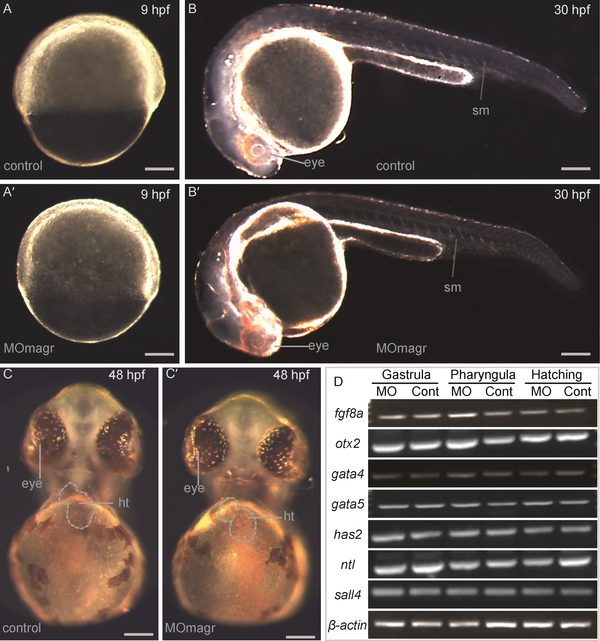
Normal development of magr-depleted embryos. Embryos were microinjected at the 1-cell stage with 2 ng of MOmagr and observed at 9, 30 and 48 hpf. A–C, Control embryos without injection; A’–C’, MOmagr-injected embryos; Showing normal organogenesis as evidenced by normal gastrulation (A and A’) and organs such as eyes, somites and heart (sm, B and B’; ht, C and C’). Scale bars, 200 µm. D, RNA expression of three germ layer markers during embryogenesis. RNA expression of ectodermal marker genes (fgf8a and otx2), mesodermal marker genes (gata4, gata5, has2 and ntl) and endodermal marker gene (sall4) dispalyed no obvious difference at gastrula (9 hpf), pharyngula (24 hpf), and hatching (48 hpf) stages between MOmagr-injected embryos (MO) and control embryos (Cont).

Figure Data
Acknowledgments
This image is the copyrighted work of the attributed author or publisher, and ZFIN has permission only to display this image to its users. Additional permissions should be obtained from the applicable author or publisher of the image. Full text @ Sci. China Ser. C-Life Sci.