
|
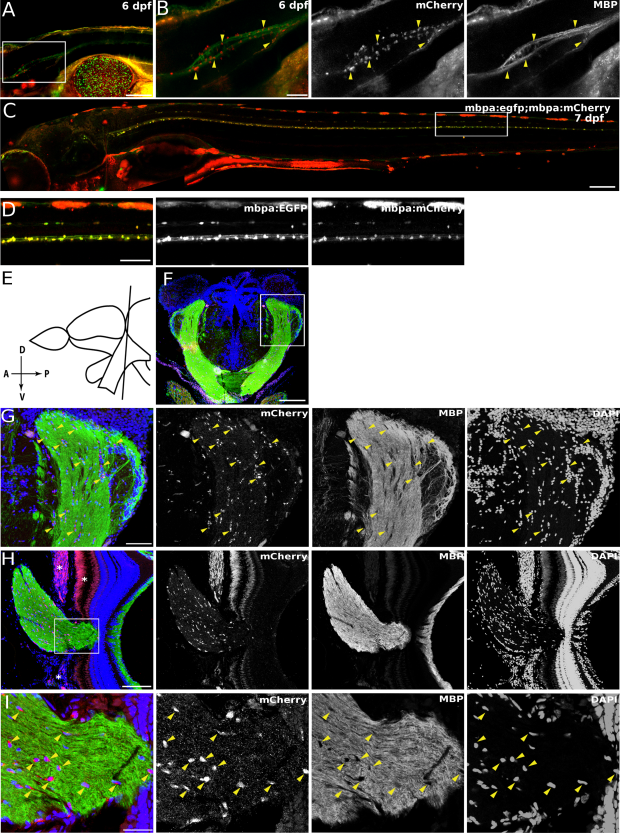
Fig. 2
The mbpa promoter recapitulates expression in mature oligodendrocytes in the larval and adult Zebrafish CNS. A: 6-dpf larvae from the Tg(mbpa:mCherry-T2A-CreERT2) line stained with antibodies against mCherry and MBP show coexistence of mCherry + cells (red) in MBP + regions (green), suggesting mature oligodendrocytes. Scale bar, 100 µm. B: Higher magnification of the area depicted (white rectangle) in A. Yellow arrowheads mark mCherry-positive oligodendrocytes located in MBP-expressing regions. Scale bar, 50 µm. C: Double-transgenic Tg(mbpa:mCherry-T2A-CreERT2); Tg(mbpa:EGFP) at 7 dpf show co-localization of EGFP and mCherry expression in oligodendrocytes in the spinal cord and hindbrain. D: Higher magnification of the area encircled in C showing EGFP/mCherry-positive oligodendrocytes. E: Scheme of cross-sections of the diencephalon with optic nerve/tract in adult Zebrafish brain as shown in F and G. F: Expression of mCherry in oligodendrocytes of the optic nerve/tract shown by IHC against mCherry (red) and MBP (green) in Tg(mbpa:mCherry-T2A-CreERT2) adult fish. Scale bar, 100 µm. G: Higher magnification of the area depicted (white rectangle) in F showing mCherry-expressing cells (yellow arrowheads) located within the MBP-expressing optic tract. Yellow arrowheads point to oligodendrocytes. Scale bar, 50 µm. H: Cross-section of the retina with the exit point of the optic nerve immunostained for mCherry (red) and MBP (green), showing mCherry-expressing cells within the MBP-expressing processes in the optic nerve as shown in individual panels. Asterisks mark unspecific auto fluorescence of the retinal pigment epithelium, photoreceptors, and extra-retinal tissue. Scale bar, 75 µm. I: Higher magnification of the area depicted (white rectangle) in H showing presumptive oligodendrocytes expressing mCherry (yellow arrowheads) and located within the MBP staining along axons of the optic nerve. DAPI stains all nuclei. Scale bar, 25 µm.