
|
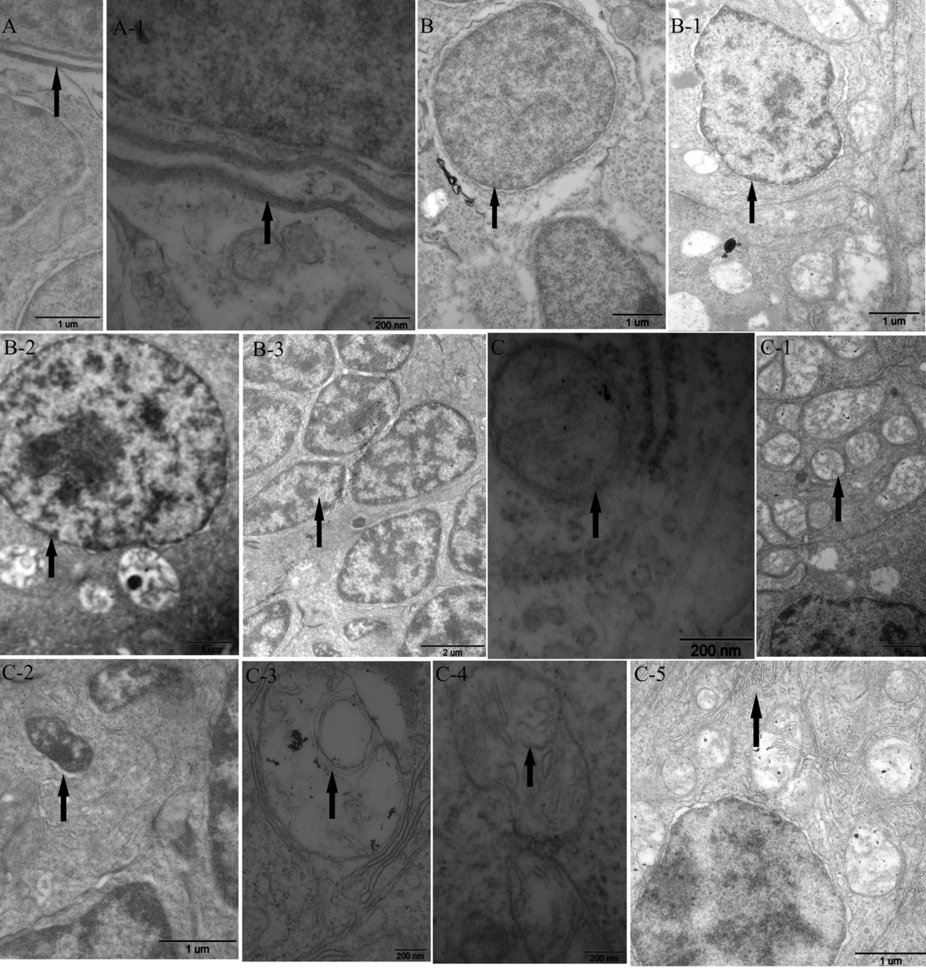
Fig. 2
TEM observation in embryos after exposure to thifluzamide for 4 days.
(A) Intact cell membranes from control group; A-1. Cell membranes from 0.19 mg/L groups; (B) Large, round nucleus from control groups; B-1. Nuclei deformation from 0.19 mg/L groups; B-2. Chromatin condensation from 0.19 mg/L groups; B-3. Chromatin condensation and nuclear fragmentation from 2.85 mg/L groups; (C) Mitochondria from control group showing distinct crista and intact membranes; C-1. Mild damage to mitochondria from 0.19 mg/L groups; C-2. Apoptotic body from 0.19 mg/L groups; C-3. Mitochondrial damage showing crista degradation from 2.85 mg/L groups; C-4. Mitochondrial swelling showing membrane degradation from 2.85 mg/L groups; C-5. Endoplasmic reticulum breakup from 2.85 mg/L groups. Arrows indicate the different sections.