
|
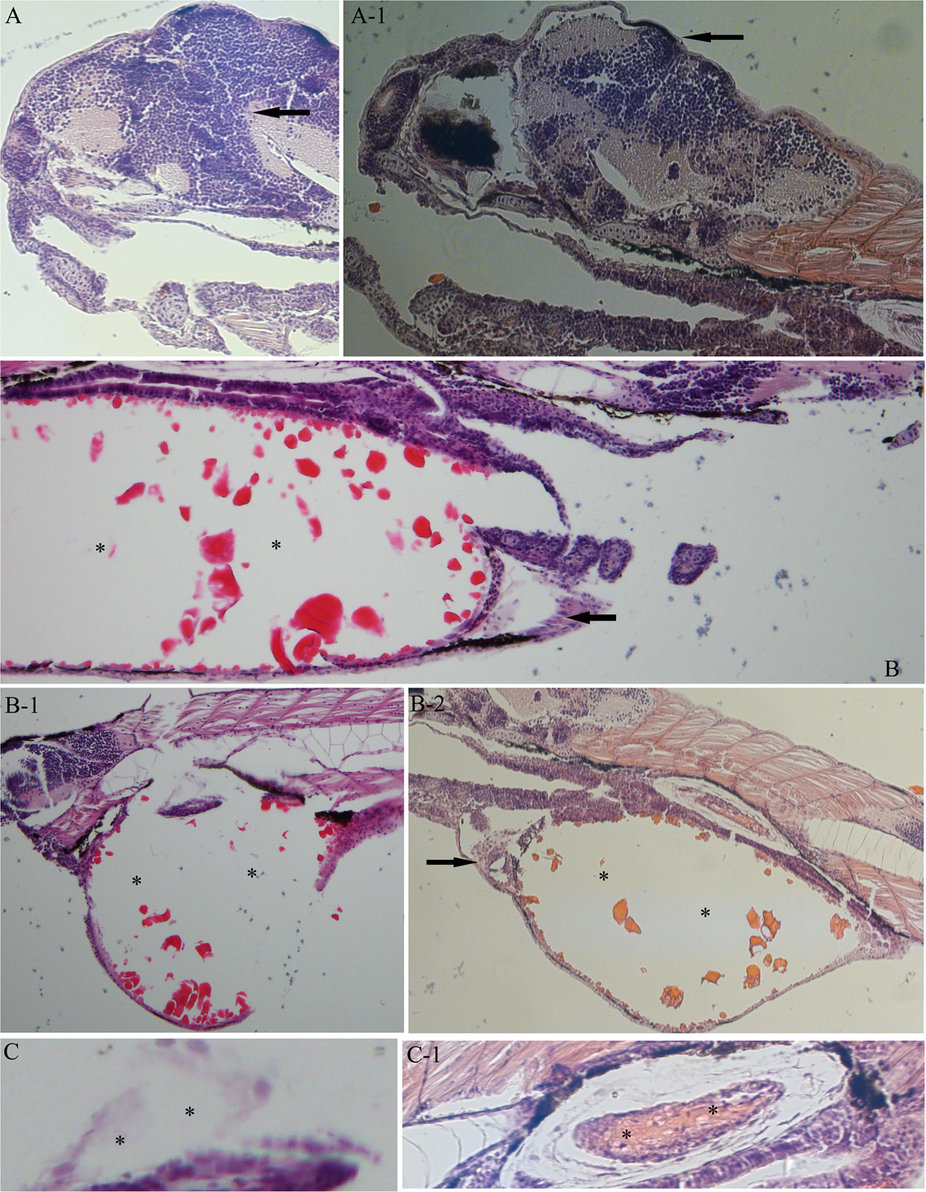
Fig. 1
Histologic lesions in zebrafish embryos after exposure to thifluzamide for 4 days.
(A) Brain from control group (arrows) (200×); A-1. Brain from 2.85 mg/L thifluzamide group showing obvious decreased cells number (arrows) (200×); (B) Yolk sac (asterisks) and pericardial region (arrows) from control group (100×); B-1. Yolk sac edema caused by 2.85 mg/L thifluzamide (asterisks) (100×); B-2. Expansion of pericardial space (arrows) due to pericardial edema in larvae (100×) and yolk sac edema (asterisks) caused by 2.85 mg/L thifluzamide (100×); (C) Gas bladder from control group showing inflated lumen (asterisks) (100×); C-1. Uninflated gas bladder caused by 2.85 mg/L (asterisks) (100×).