
Fig. 4
- ID
- ZDB-IMAGE-170104-9
- Genes
- Publication
- Jiménez-Amilburu et al., 2016 - In Vivo Visualization of Cardiomyocyte Apicobasal Polarity Reveals Epithelial to Mesenchymal-like Transition during Cardiac Trabeculation
- All Figures
- Figures for Jiménez-Amilburu et al., 2016
|
Fig. 4
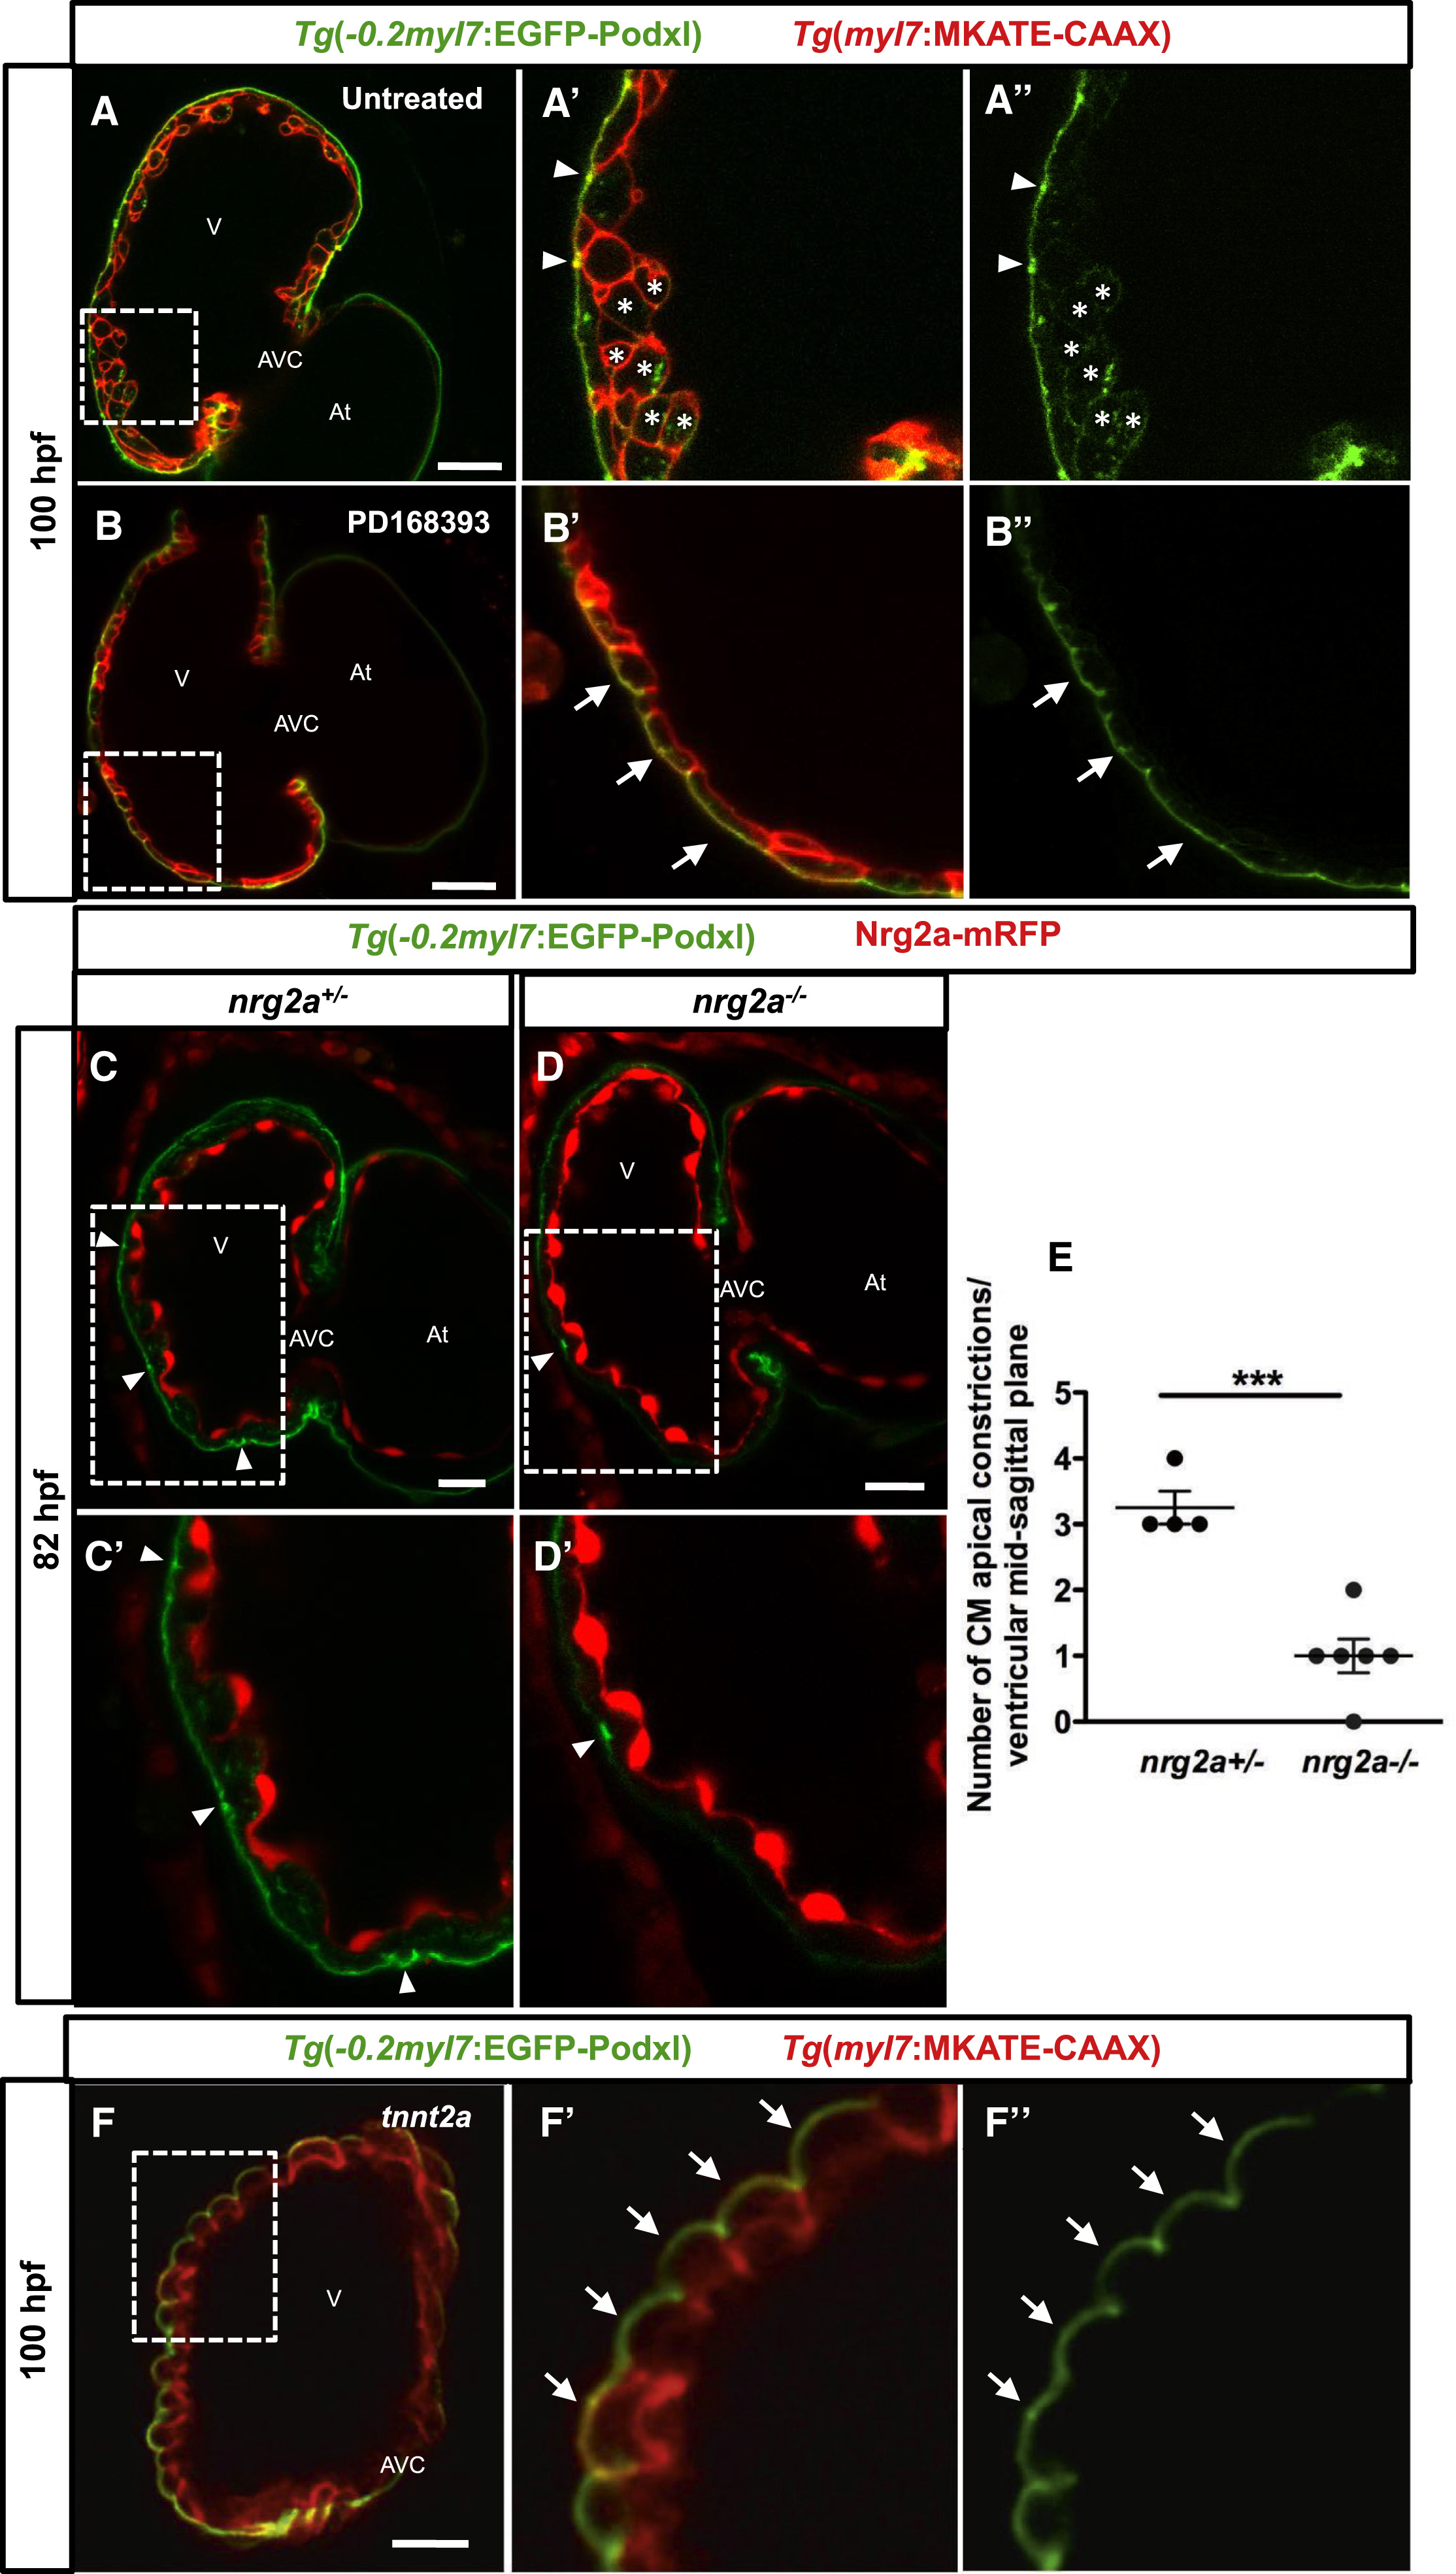
CM Depolarization Is Nrg/ErbB2 Signaling-, and Blood Flow- and Cardiac Contractility-Dependent
(A–B'') Confocal images (mid-sagittal sections) of 100-hpf Tg(−0.2myl7:EGFP-podxl);Tg(myl7:MKATE-CAAX) zebrafish hearts. Boxed area in (A) is shown in (A') and (A''). Untreated larvae show apical constrictions (A' and A'', arrowheads) and depolarized CMs (A' and A'', asterisks). (B–B''). Larvae treated with 10 μM PD168393 from 56 to 100 hpf exhibit no apical constrictions or depolarized CMs (B' and B'', arrows). Boxed areas in (B) are shown in (B') and (B'').
(C–D') Confocal images (mid-sagittal sections) of 82-hpf Tg(−0.2myl7:EGFP-podxl) zebrafish hearts from a nrg2a+/− incross. Boxed areas in (C) and (D) are shown in (C') and (D'). Heterozygous larvae (nrg2a+/−) exhibit an average of three apical constrictions per ventricle at the mid-sagittal plane (C and C′, arrowheads), while homozygous mutants (nrg2a−/−) exhibit a reduced number of apical constrictions (D and D', arrowheads).
(E) Graph showing the number of apical constrictions in nrg2a heterozygous and homozygous mutant larvae; n = 4 and n = 6, respectively. Each dot represents one heart. Data are shown as mean ± SEM. ∗∗∗p < 0.001 by Student’s t test.
(F–F'') 100-hpf tnnt2a morphant hearts exhibit no apical constrictions or depolarized CMs (F' and F'', arrows). Boxed areas in (F) are shown in (F') and (F'').
At, atrium; V, ventricle; AVC, atrioventricular canal. Scale bars, 20 μm.