
|
Fig. 4 S1
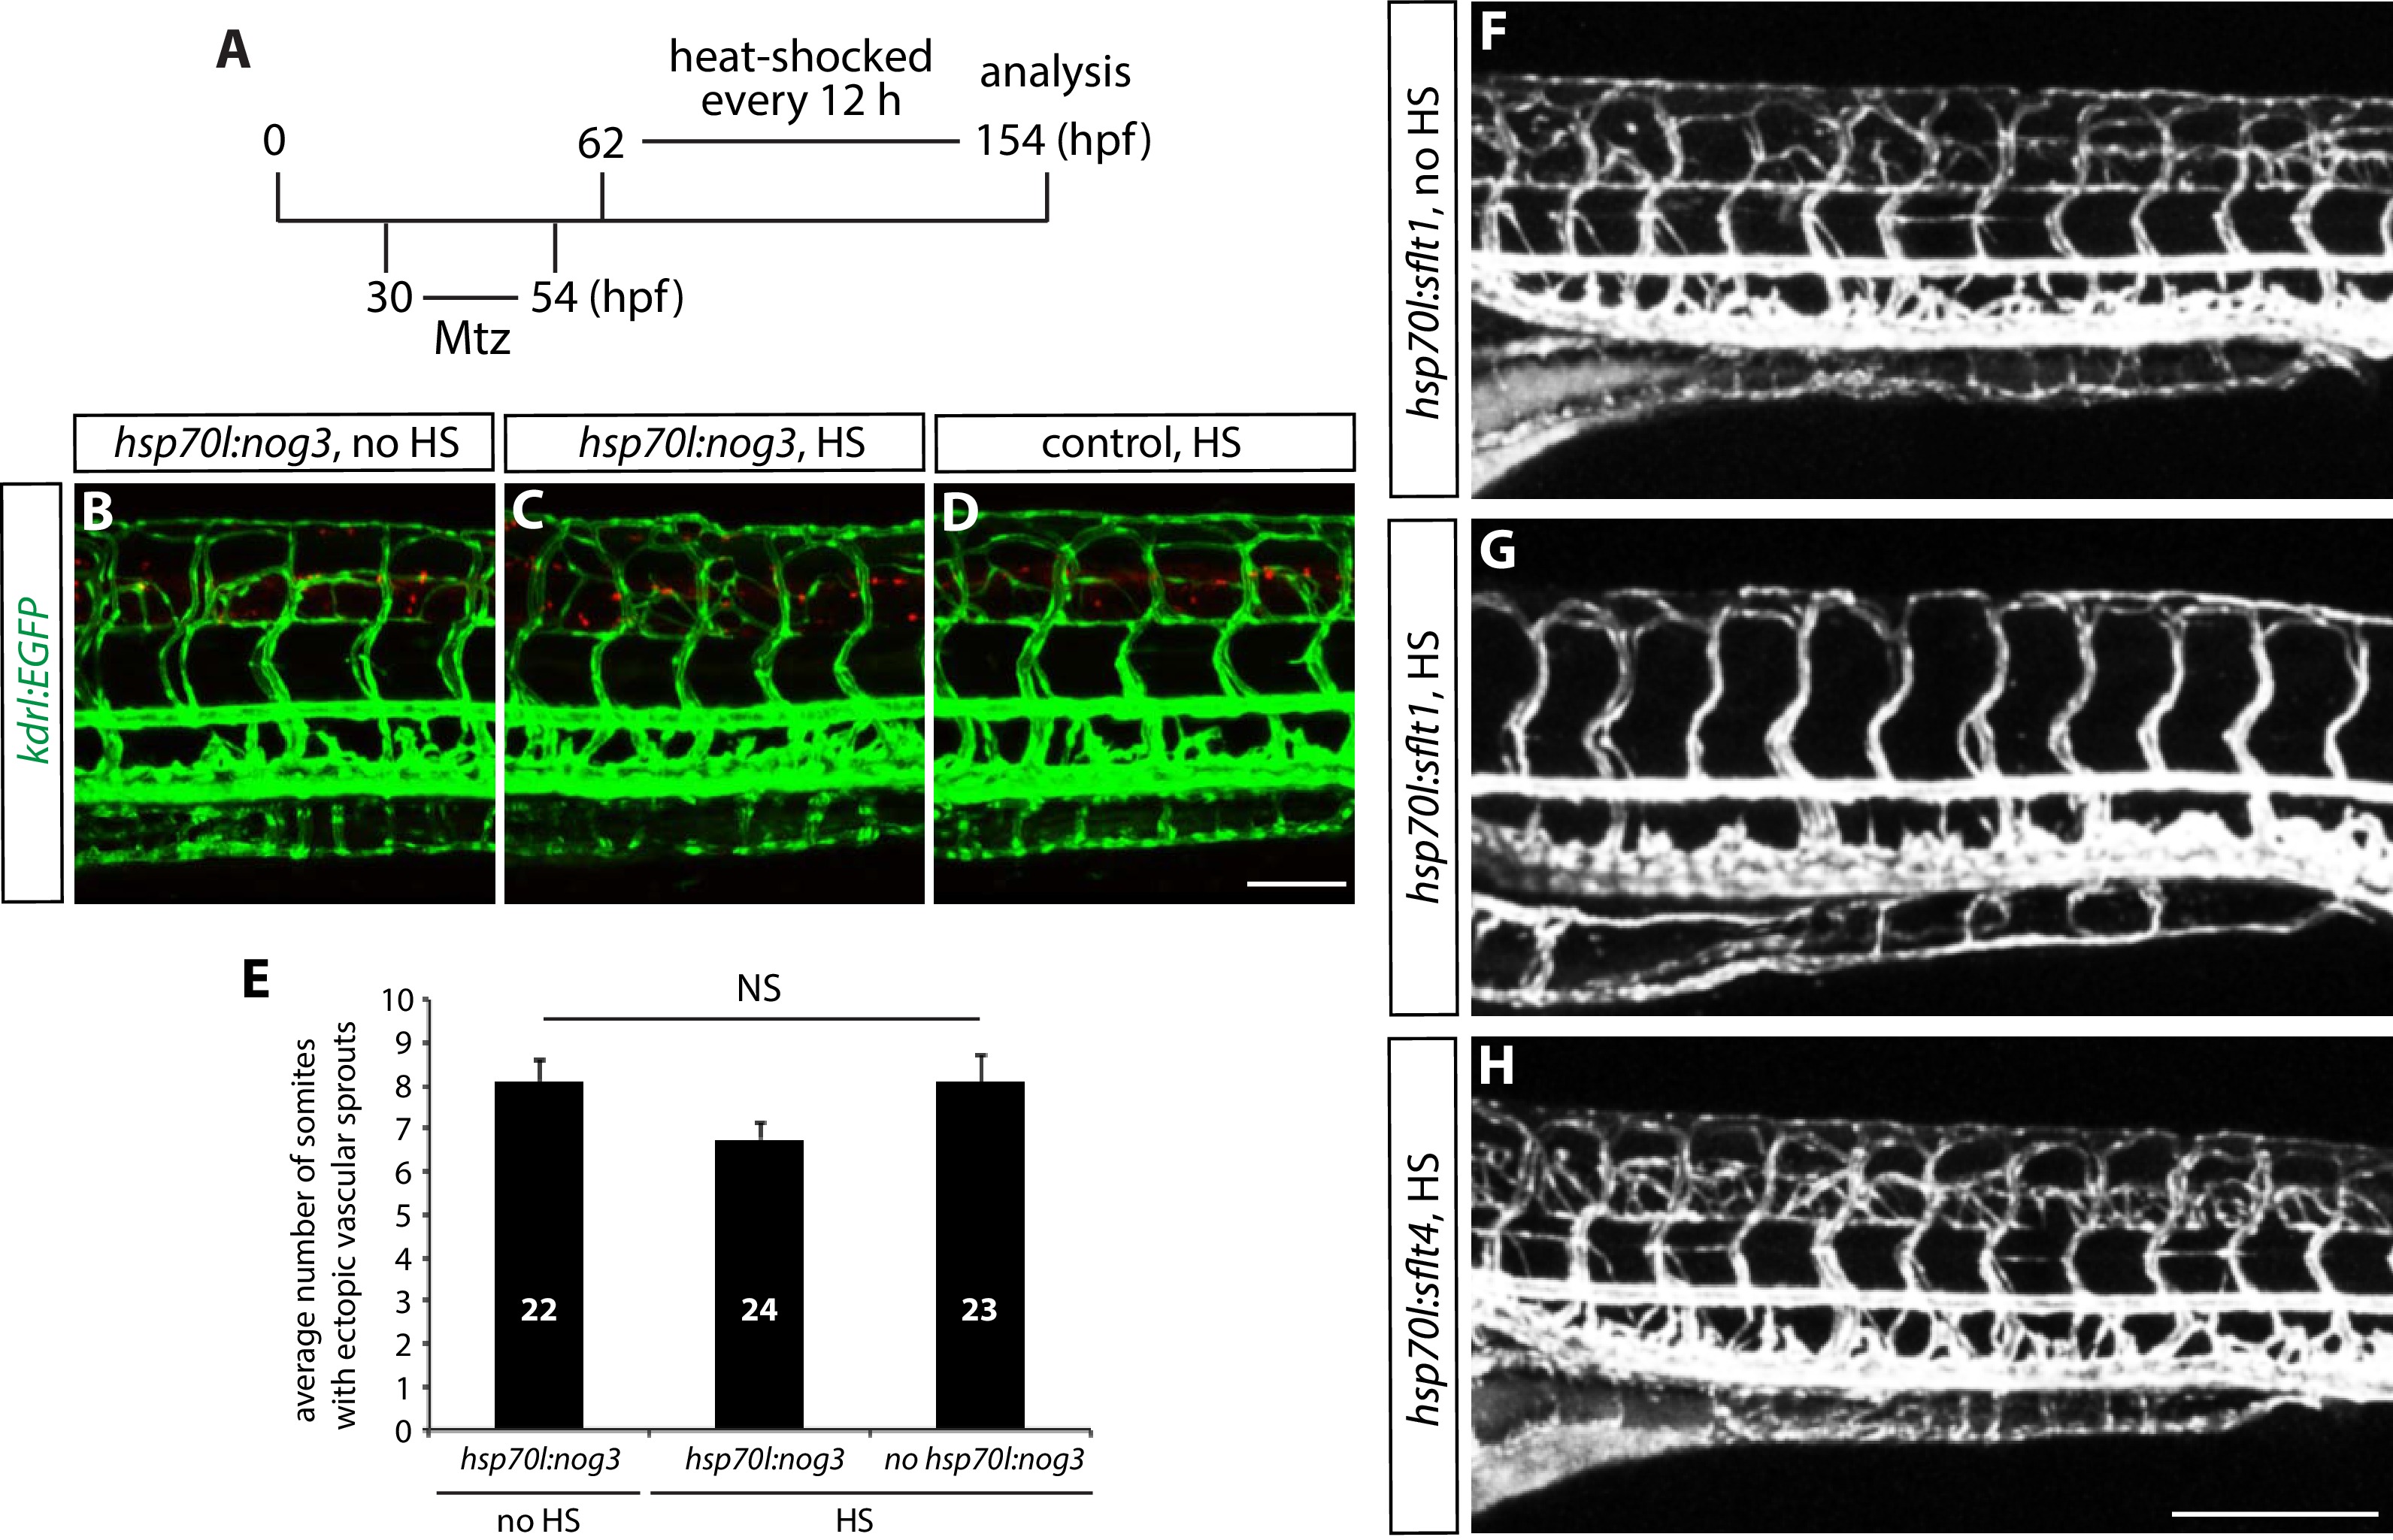
Genetic inhibition of Vegfr2, but not Vegfr3 or Bmp, signaling blocks ectopic vessel sprouting after radial glia ablation.
(A) Experimental time course for data shown in panels (B–H). (B–D) 154 hpf TgBAC(gfap:gal4ff);Tg(UAS:mcherry-NTR);Tg(kdrl:EGFP);Tg(hsp70l:nog3) (B and C) and TgBAC(gfap:gal4ff);Tg(UAS:mcherry-NTR);Tg(kdrl:EGFP) (D) trunk vasculature visualized by Tg(kdrl:EGFP) expression. Animals were treated with 2 mM Mtz between 30 and 54 hpf and then given no heat shock (B) or multiple heat shocks starting at 62 hpf and every 12 hr after that (C and D). Scale bar, 100 µm. (E) Quantification of average number of somites that showed ectopic blood vessels for the experiments shown in panels B–D (10 somites examined per animal; ≥22 animals examined per condition). Values represent means ± SEM. (F–H) 154 hpf TgBAC(gfap:gal4ff);Tg(UAS:mcherry-NTR);Tg(kdrl:EGFP);Tg(hsp70l:sflt1, cryaa:cerulean) (F and G), and TgBAC(gfap:gal4ff);Tg(UAS:mcherry-NTR);Tg(kdrl:EGFP);Tg(hsp70l:sflt4, cryaa:cerulean) (H) trunk vasculature visualized by Tg(kdrl:EGFP). Animals were treated with 2 mM Mtz between 30 and 54 hpf and then given no heat shock (F) or multiple heat shocks starting at 62 hpf and every 12 hr after that (G and H). Overexpression of sFlt-1, but not that of sFlt-4, blocks ectopic vessel sprouting after radial glia ablation. Scale bar, 200 µm.