
Fig. S5
- ID
- ZDB-IMAGE-161221-58
- Publication
- Tornini et al., 2016 - Live Monitoring of Blastemal Cell Contributions during Appendage Regeneration
- All Figures
- Figures for Tornini et al., 2016
|
Fig. S5
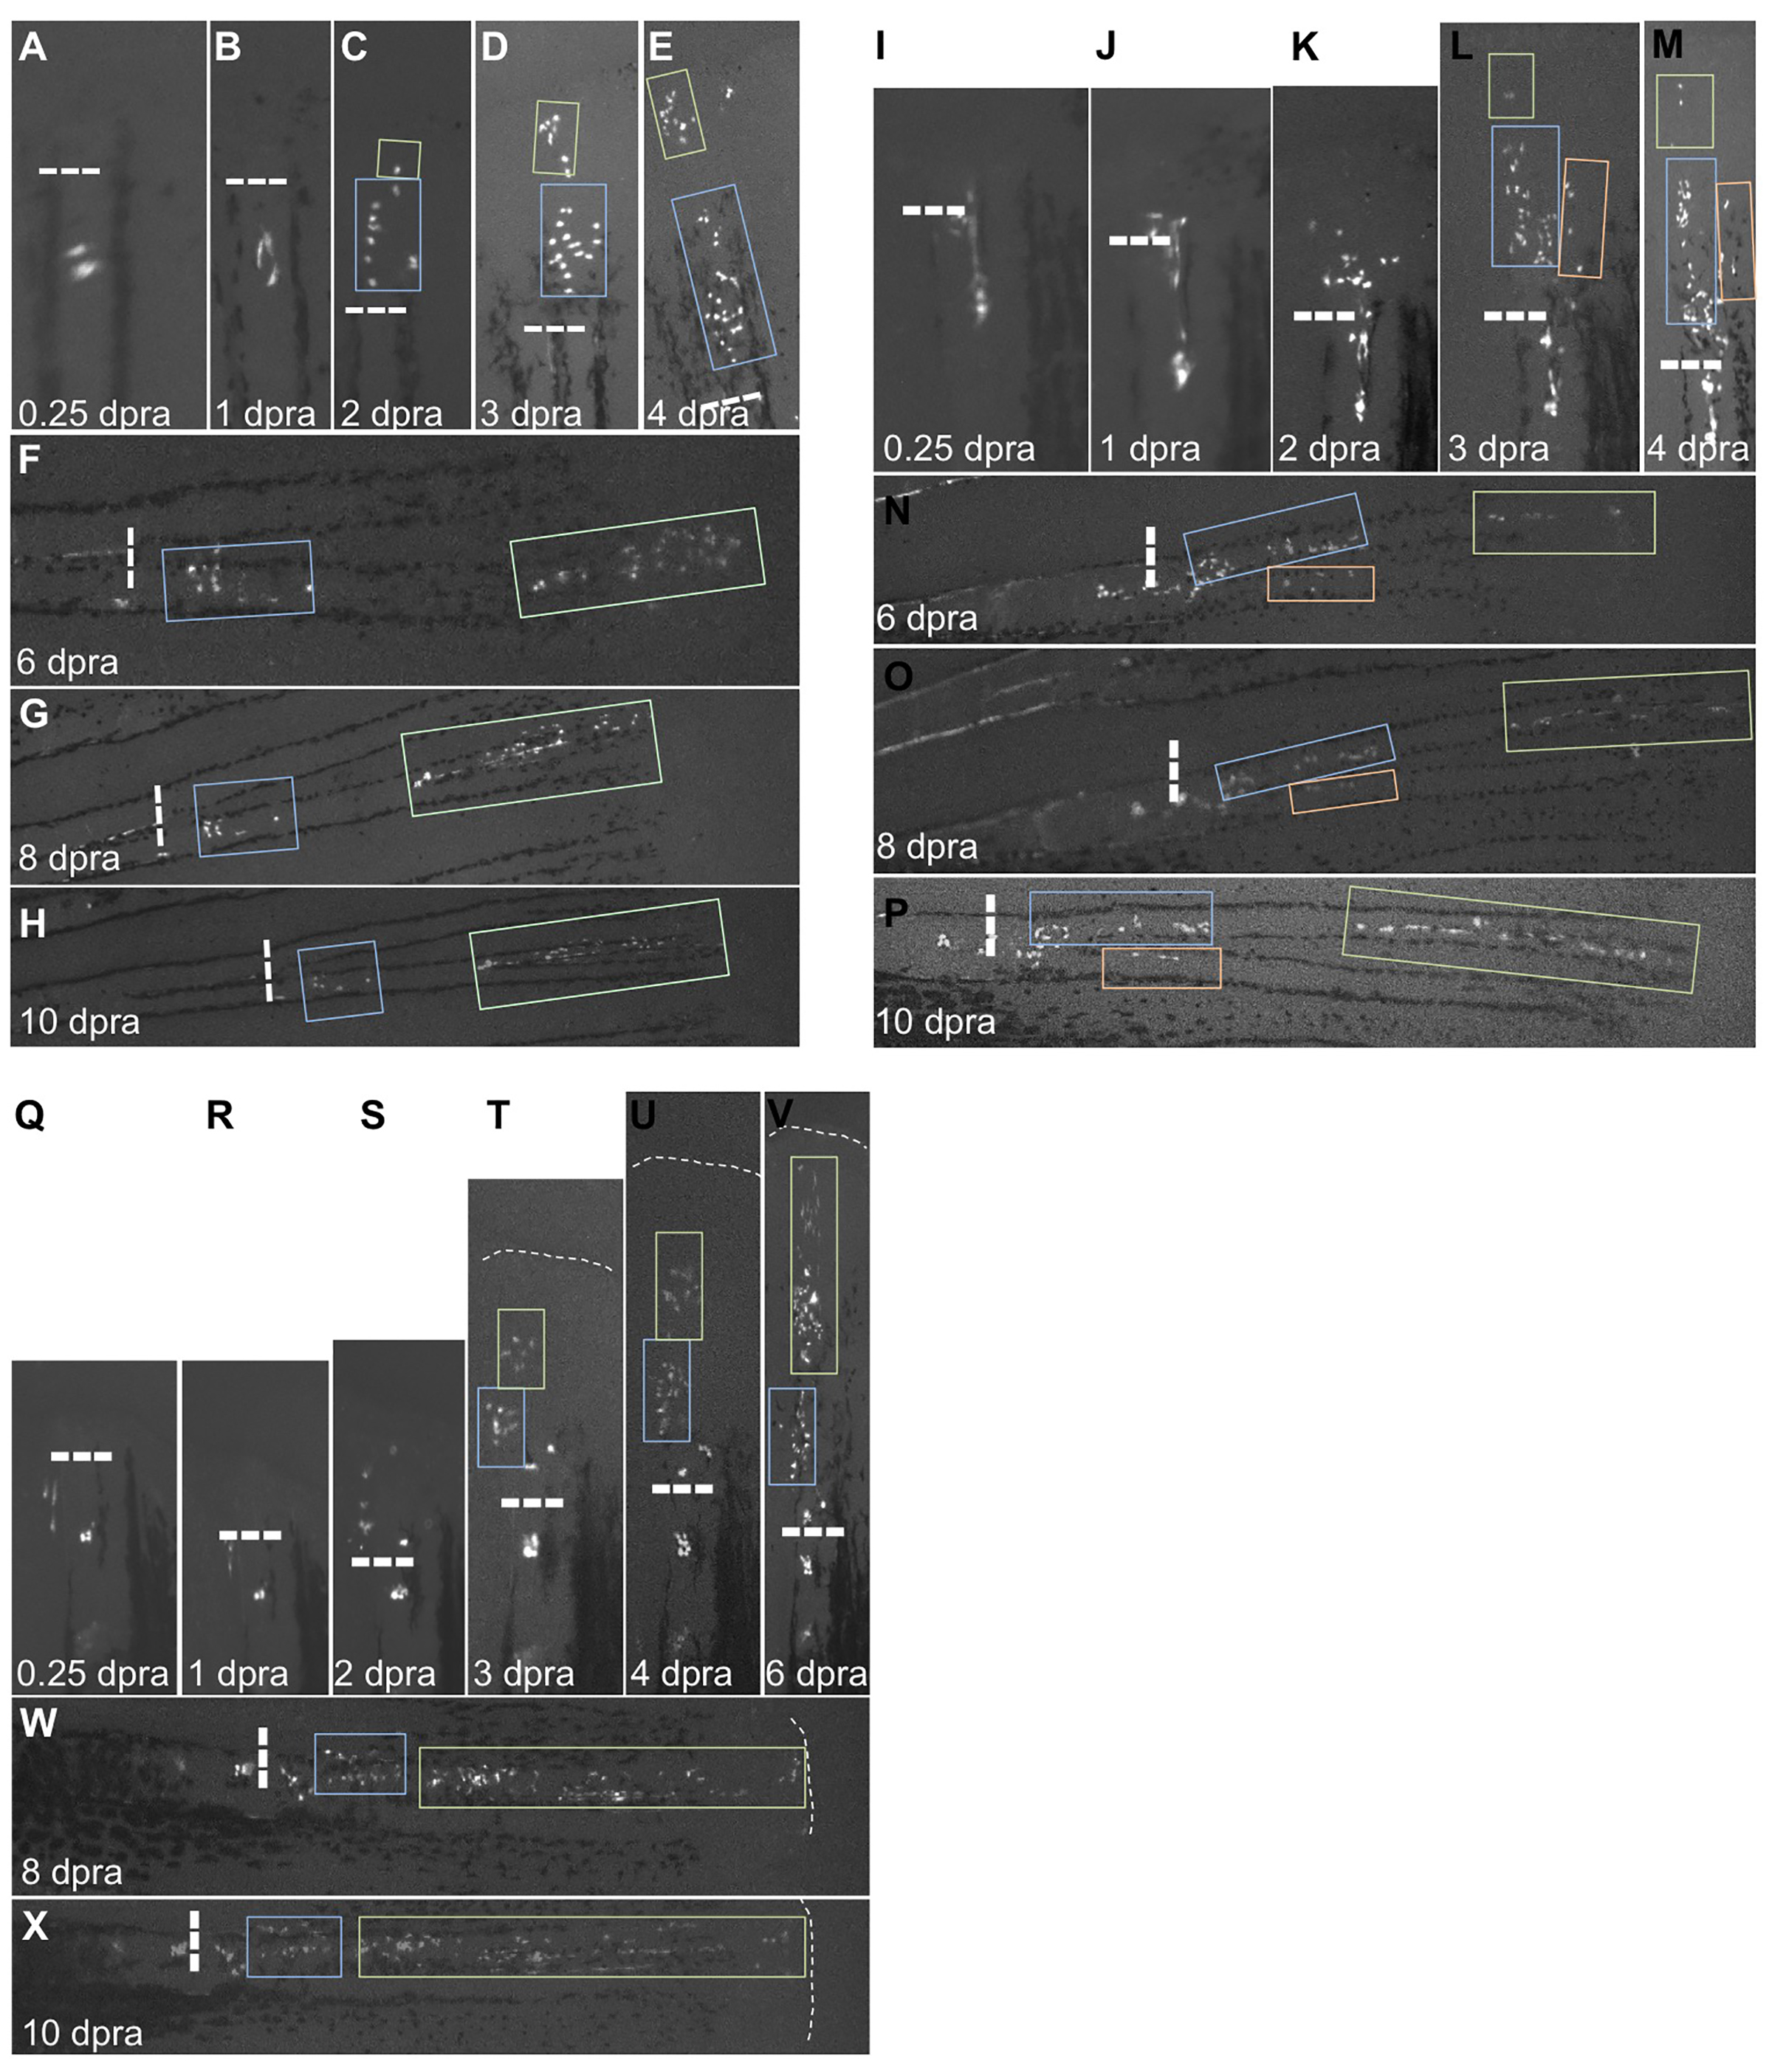
Clones Within a Single Blastema Generally Maintain PD Position Throughout Regeneration, Related to Figure 5
(A–H) Re-amputation experiment visualizing recruitment of labeled connective tissue cells from a P clone to form a new blastema, shown at 0.25 (A), 1 (B), 2 (C), 3 (D), 4 (E), 6 (F), 8 (G), and 10 days post re-amputation (dpra) (H). Blue and green boxes track progeny of cells from the 2 dpra blastema. Dashed lines, amputation planes.
(I–P) Re-amputation experiment visualizing recruitment of labeled connective tissue cells from a P clone to form a new blastema, shown at 0.25 (I), 1 (J), 2 (K), 3 (L), 4 (M), 6 (N), 8 (O), and 10 days post re-amputation (dpra) (P). Blue, green, and orange boxes track progeny of cells from the 3 dpra blastema. Dashed lines, amputation planes.
(Q–X) Re-amputation experiment visualizing recruitment of labeled connective tissue cells from a P clone to form a new blastema, shown at 0.25 (Q), 1 (R), 2 (S), 3 (T), 4 (U), 6 (V), 8 (W), and 10 days post re-amputation (dpra) (X). Blue and green boxes track progeny of cells from the 3 dpra blastema. Dashed lines, amputation planes.