
|
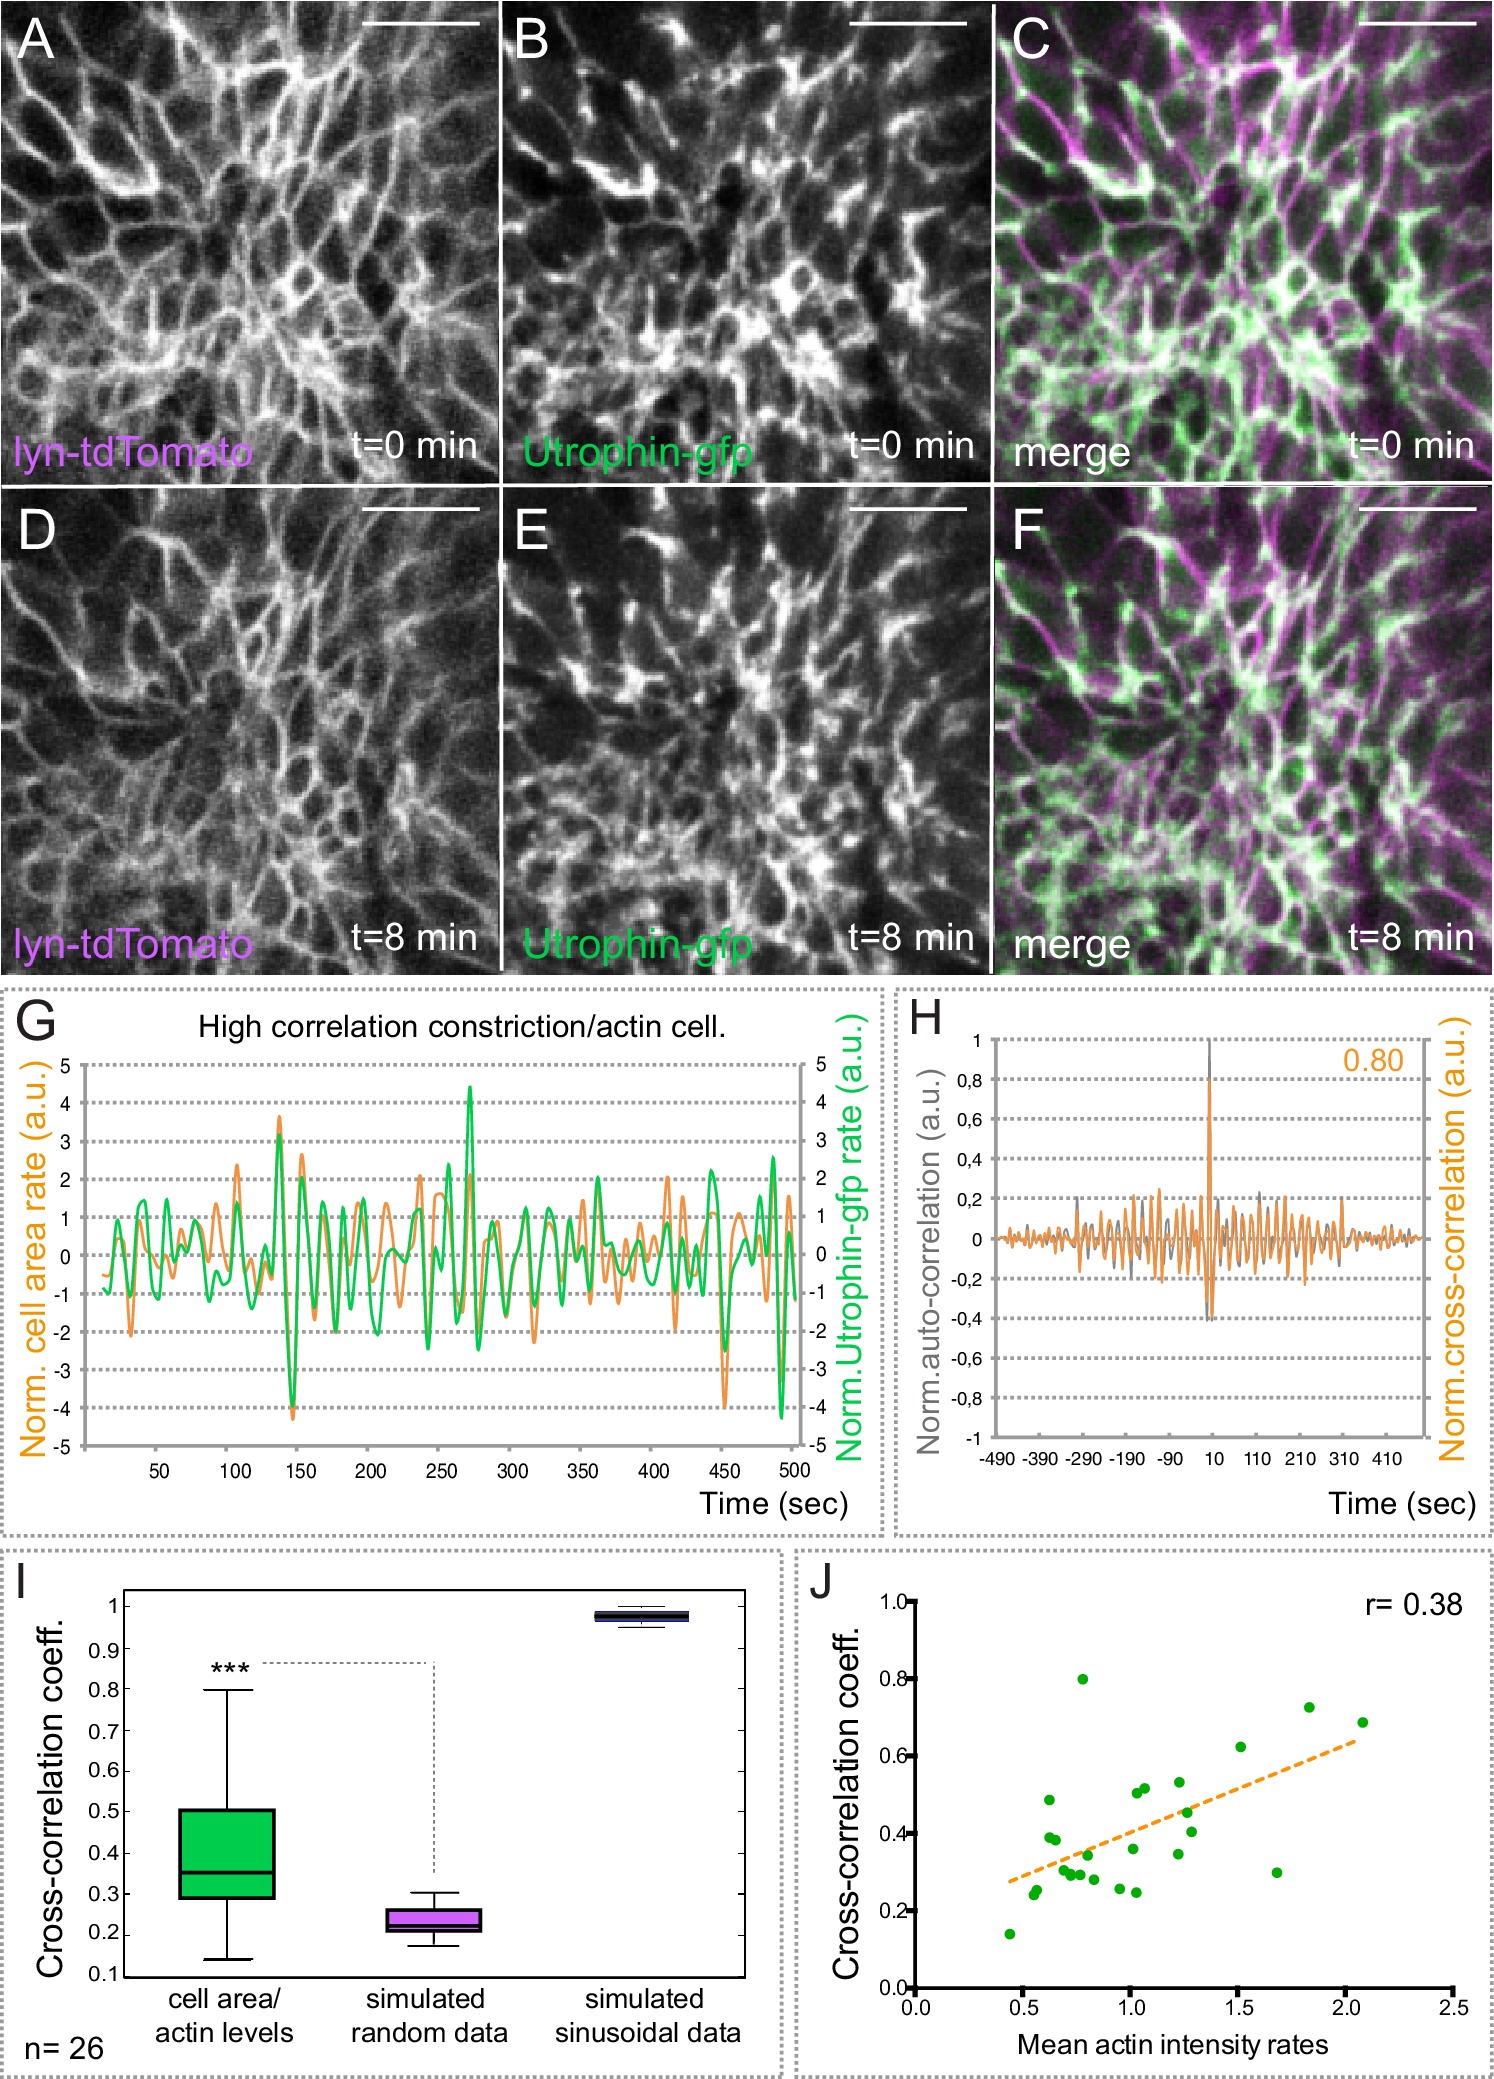
Fig. 4
Basal actin dynamics in constricting retinal cells.
(A–F) Actin dynamics, as revealed by utrophin-gfp, and membrane oscillations were simultaneously examined by time lapse in the line tg(vsx2.2:lyn-tdTomato) at 20 hpf (see Video 4). Note that F-actin localizes mainly at the cellular cortex. Scale bars = 10 µm. (G) Normalized basal area rate (orange) and normalized utrophin-gfp rate (green) are shown over time for a cell displaying a high correlation between actin oscillations and membrane expansion. Area rate and Utrophin-gfp rate were normalized dividing by the mean of their absolute values. (H) Normalized auto-correlation (grey line) and cross-correlation (orange) are shown for cell represented in G. Maximum cross-correlation (0.8) is indicated. (I) Box plot comparison of cross-correlation results between actin vs. membrane oscillations, simulated random and simulated sinusoidal signals shows a significant (p<0.001; T-test; n = 26) positive correlation between actin accumulation and basal area expansion. (J) Scattered plot showing the dependency of cross-correlation coefficients (n = 26) on mean actin intensity rates. Linear regression line (orange) and linear correlation coefficient (0.38) are indicated.