
Image
|
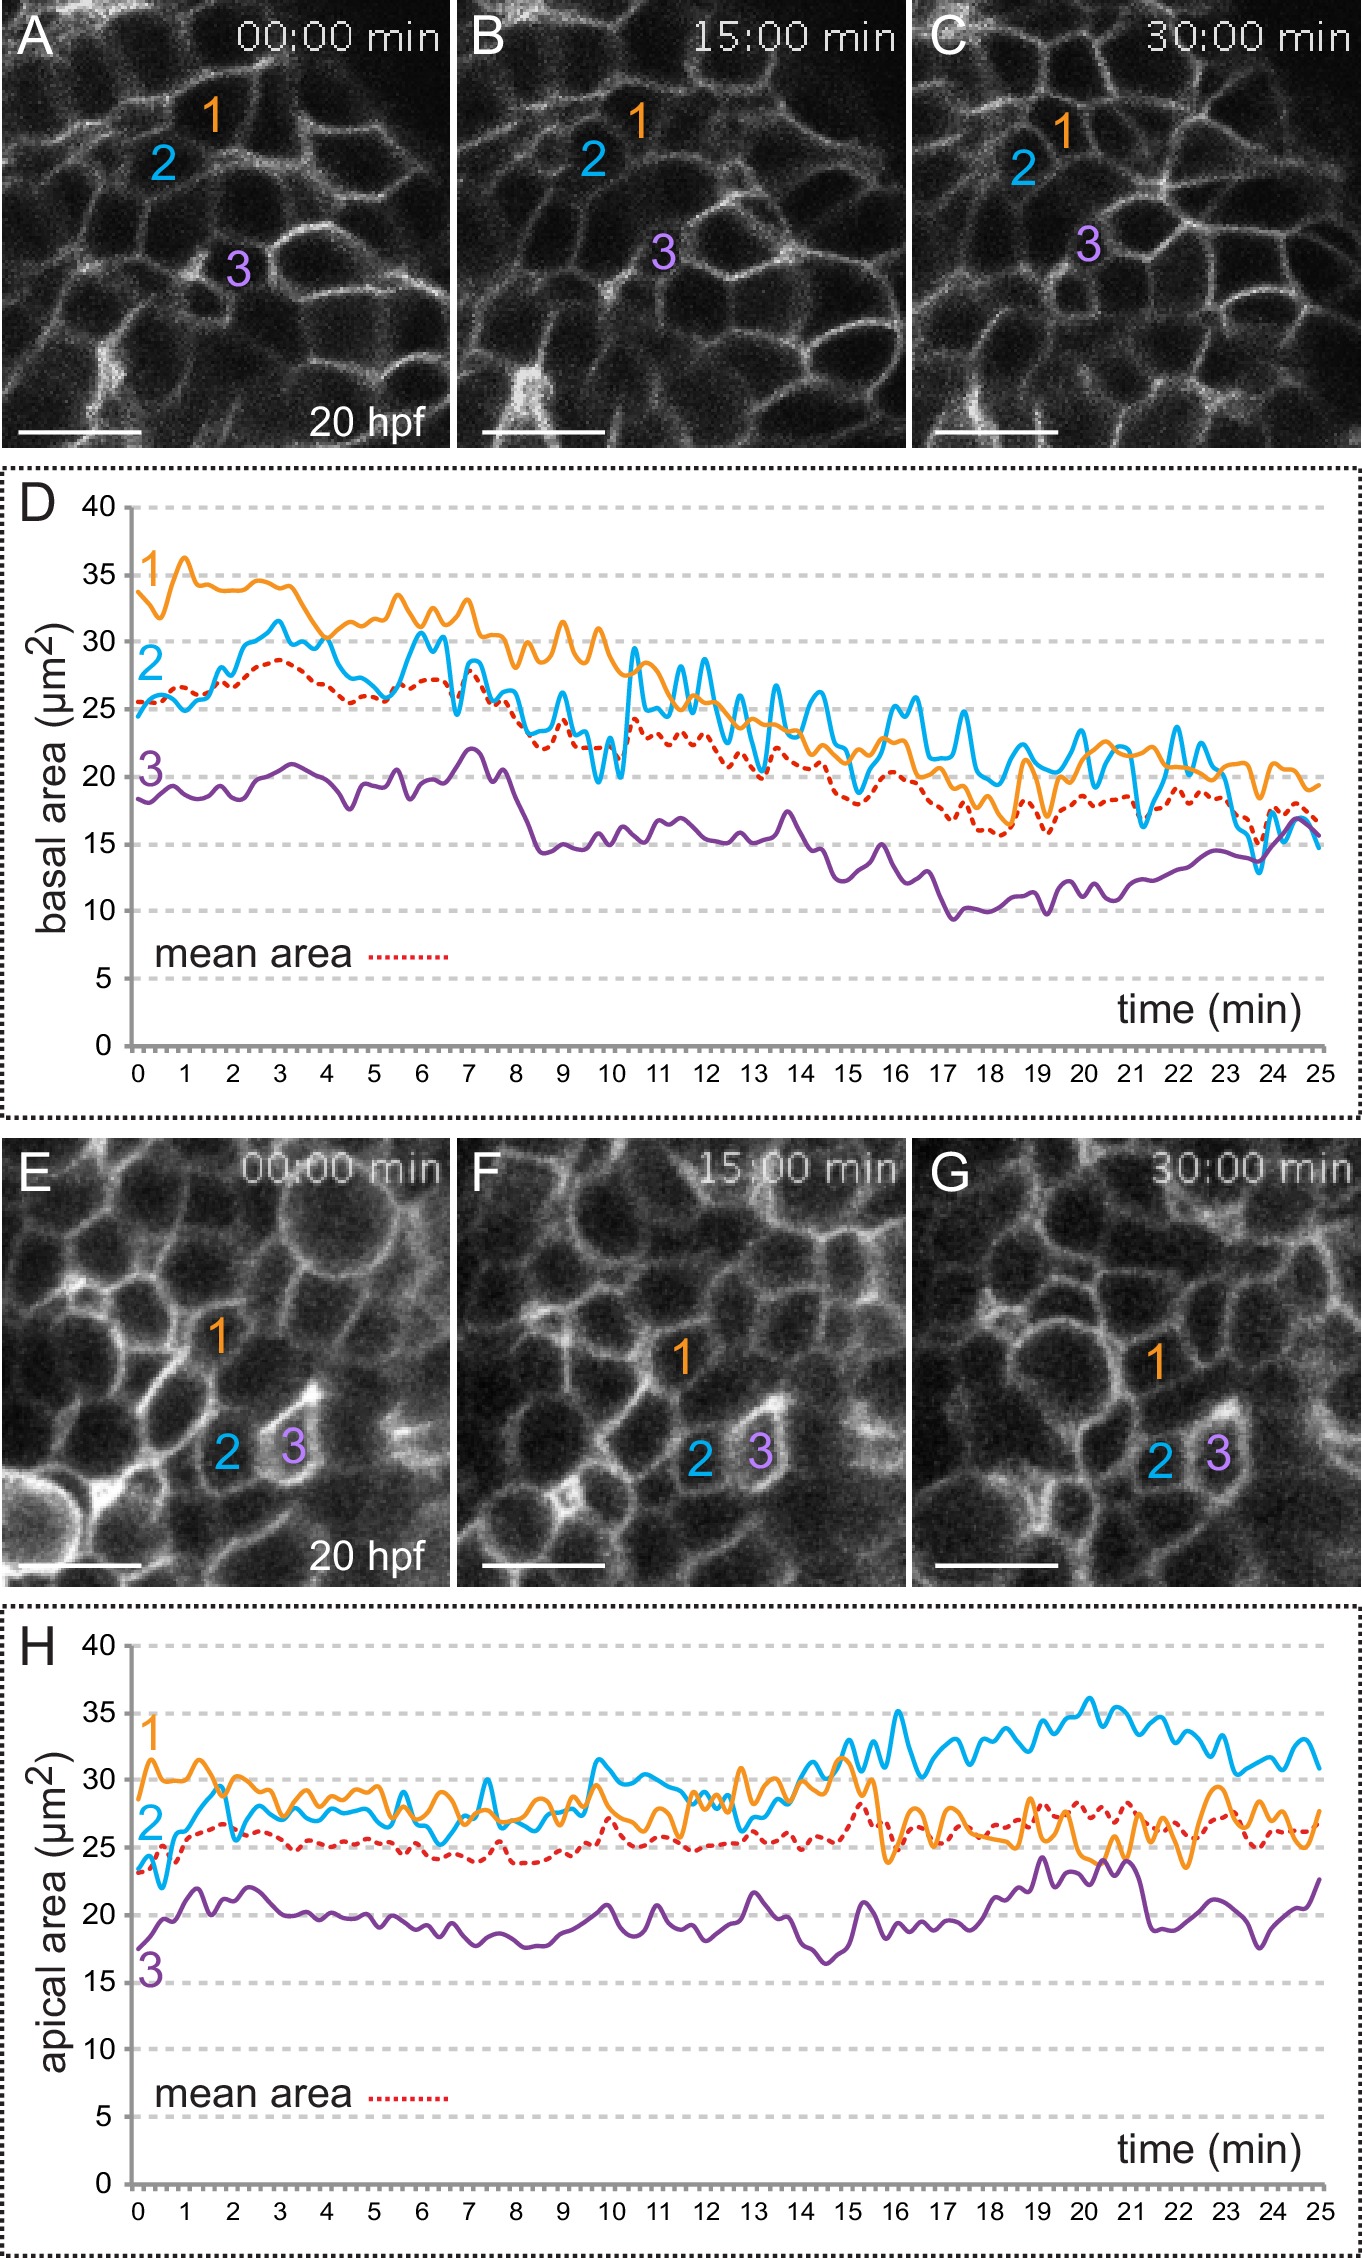
Figure Caption
Fig. 2
Quantitative analysis of membrane oscillations in tg(vsx2.2:GFP-caax) embryos.
Cell area dynamics at the basal (A–-D) and apical (E–H) surfaces is shown for three individual cells (color coded). Absolute basal (D) and apical (H) areas in µm2 are represented versus time for the individual cells. The mean area indicates a progressive constriction of the basal, but not apical surfaces over time (D, H). Scale bars = 10 µm.
Acknowledgments
This image is the copyrighted work of the attributed author or publisher, and
ZFIN has permission only to display this image to its users.
Additional permissions should be obtained from the applicable author or publisher of the image.
Full text @ Elife