
Fig. 5
- ID
- ZDB-IMAGE-161219-21
- Publication
- Yang et al., 2016 - Deletion of Pr130 Interrupts Cardiac Development in Zebrafish
- All Figures
- Figures for Yang et al., 2016
|
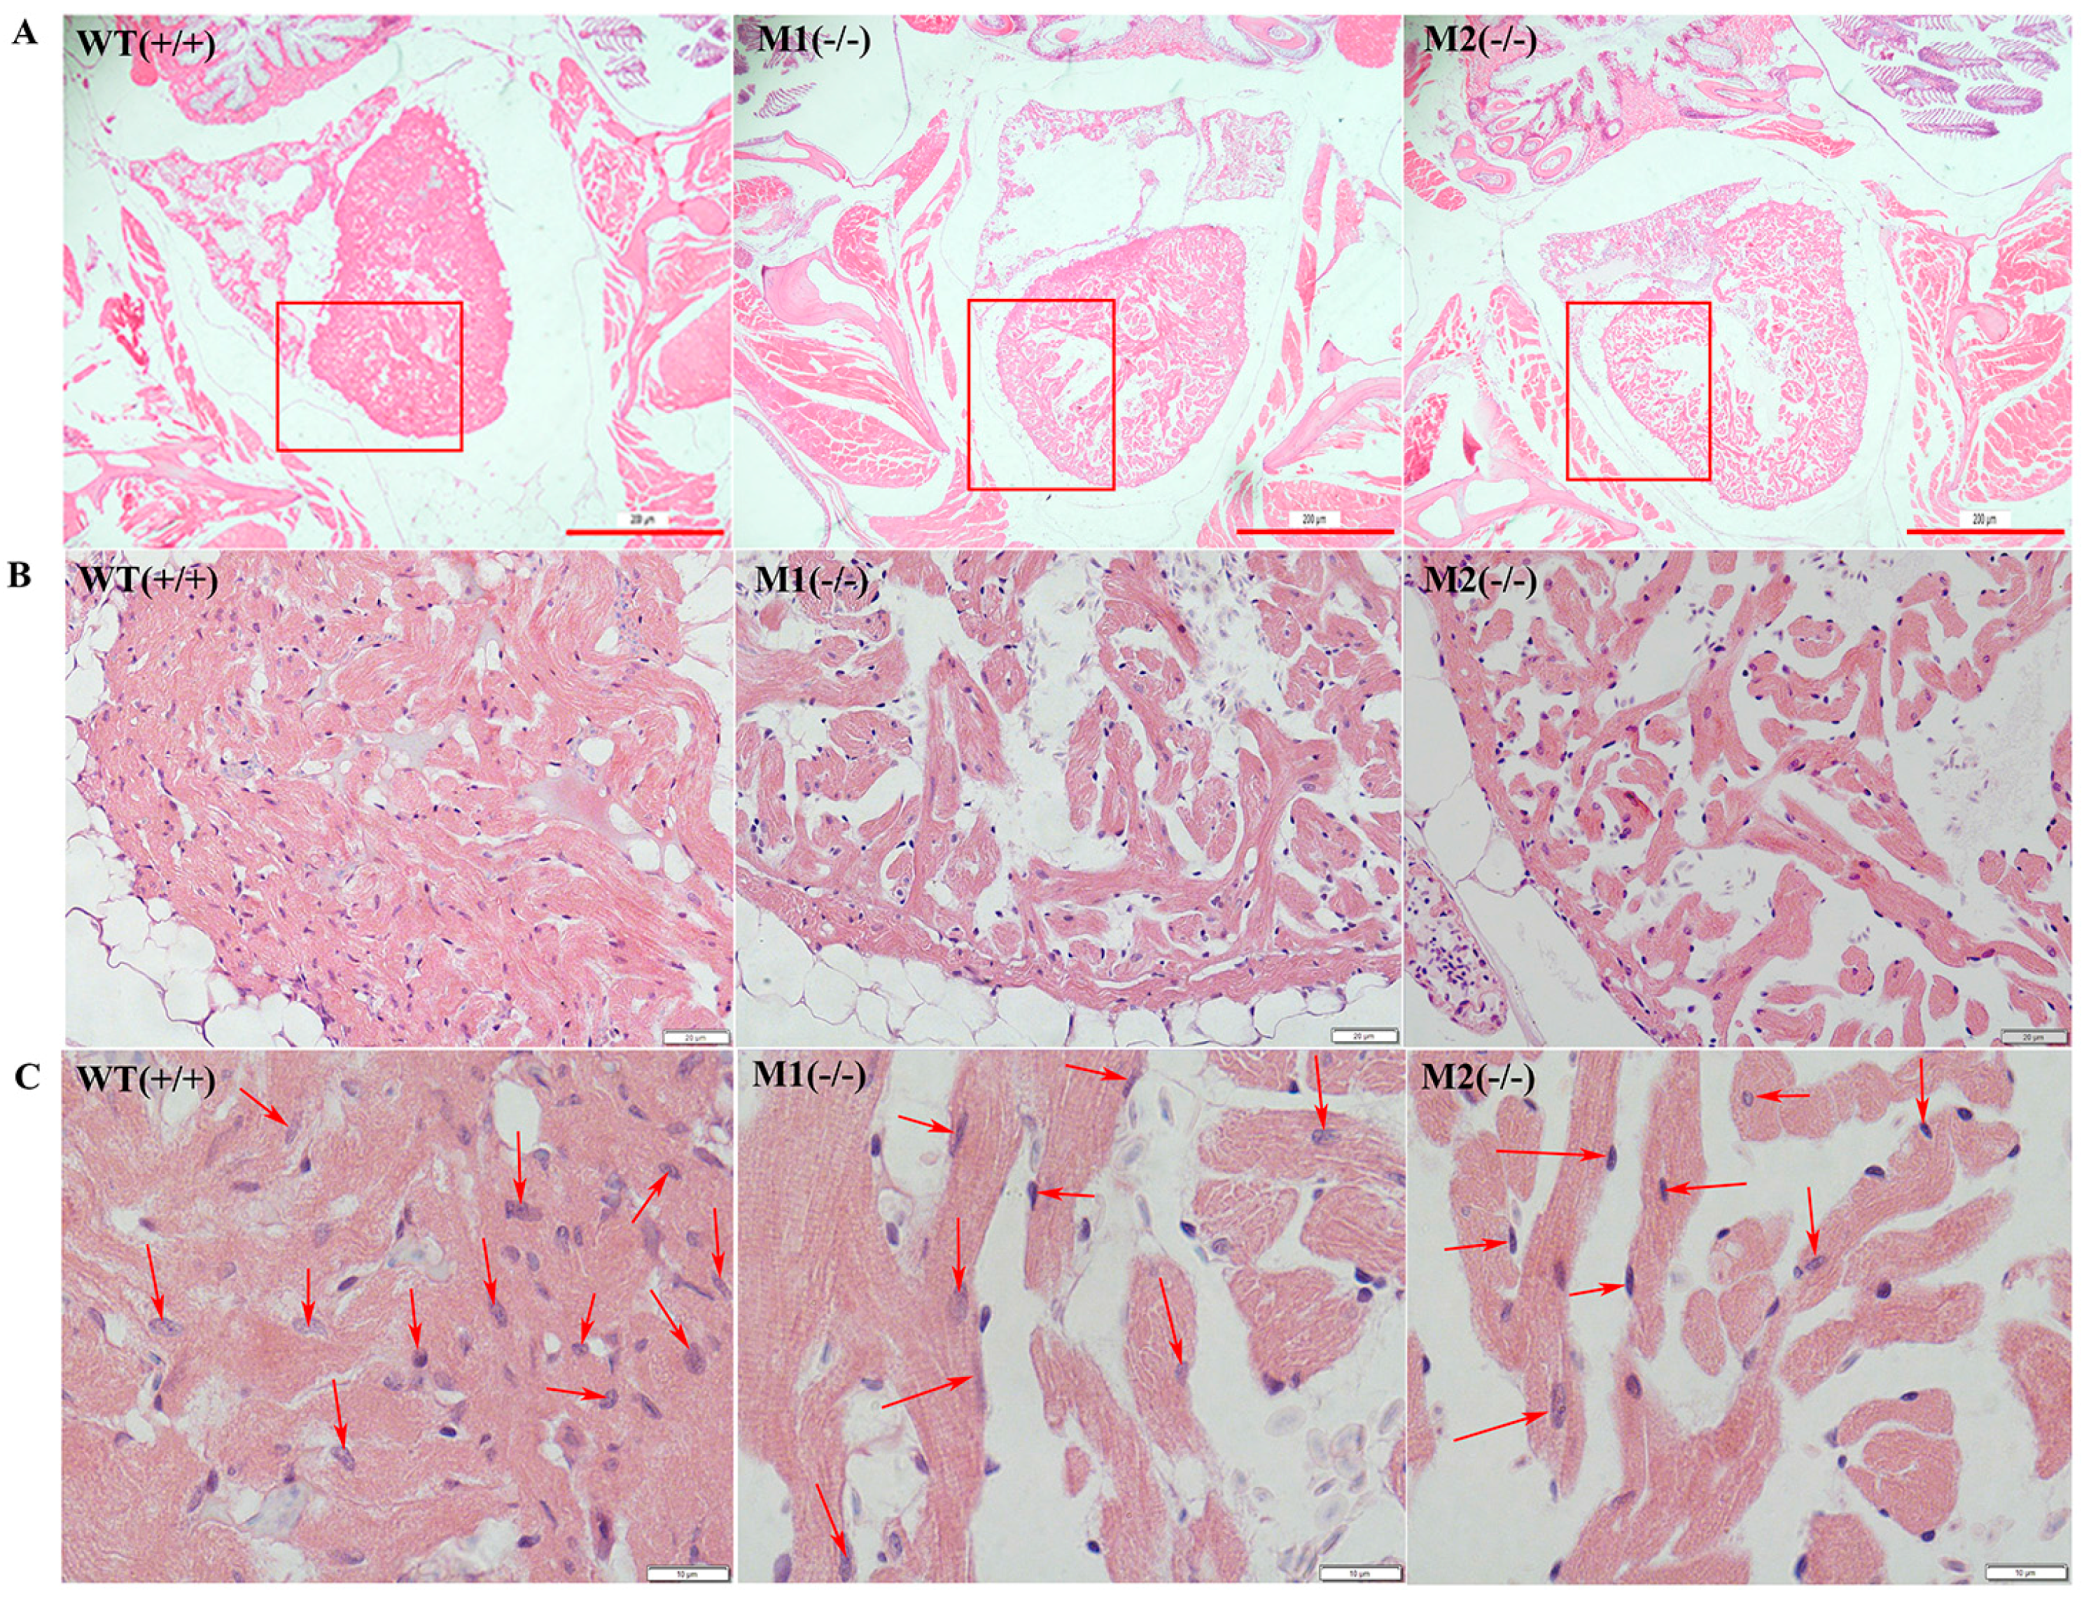
Fig. 5
Decreased cardiomyocytes in pr130-/- zebrafish. (A) Representative images of H&E staining of adult heart tissue at 40× magnification. Scale bars, 200 µm; (B) Higher magnification of the boxed regions (400× magnification). The heart tissues of WT, M1, and M2 were from the same region of heart. Scale bars, 20 µm; (C) Pr130-/- exhibited reduced cardiomyocytes. Red arrows indicate the myocardium nucleus. Scale bars, 10 µm; (D) The cardiomyocytes in heart tissues of controls and pr130-/- adult zebrafish were quantified and presented in the bar graph. We calculated the number of cardiomyocytes in each of four chosen fields per fish at a magnification of 1000×. n = 16 hearts analyzed per panel. Data represent the mean ± SD. *, p < 0.05.