
Image
|
Figure Caption
Fig. 1 S1
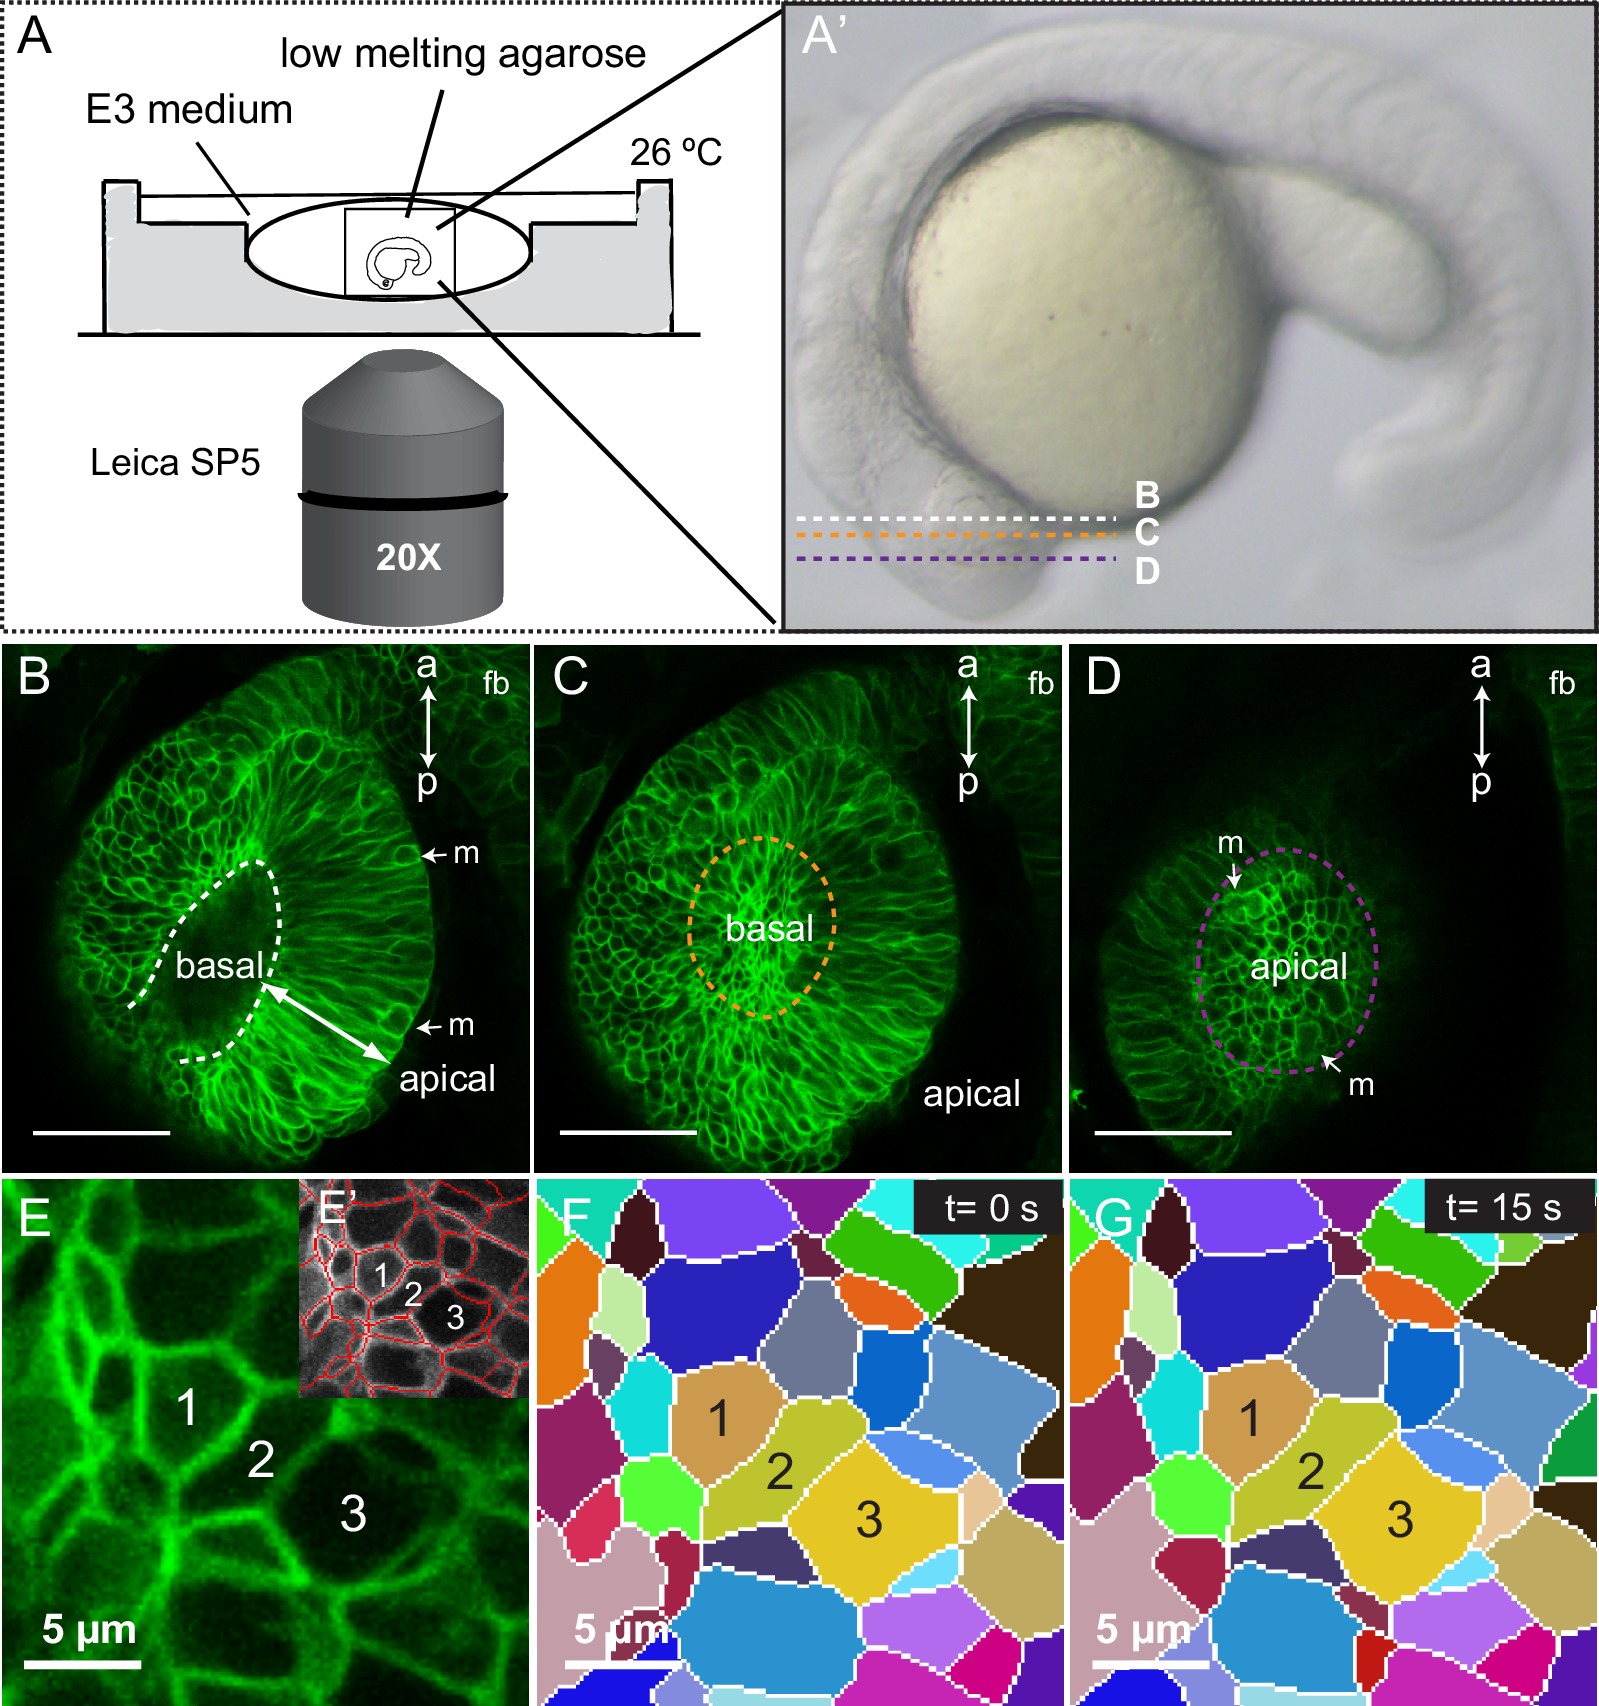
Imaging setup and segmentation.
(A, A’) Schematic representation of the imaging setup. Confocal planes for panels B–D are indicated in A’. (B–D) Optical sections through a 20 hpf tg(vsx2.2:GFP-caax) retina showing basal (orange in C) and apical (purple in D) planes. Mitotic figures (m) and antero-posterior axis (a–p) are indicated. fb = forebrain. (E–G) Automatic cell segmentation (E–E’) and manual tracking of the segmented cells through time (F, G) are shown. Scale bars = 50 µm in B–D and 5 µm in E–G.
Acknowledgments
This image is the copyrighted work of the attributed author or publisher, and
ZFIN has permission only to display this image to its users.
Additional permissions should be obtained from the applicable author or publisher of the image.
Full text @ Elife