
|
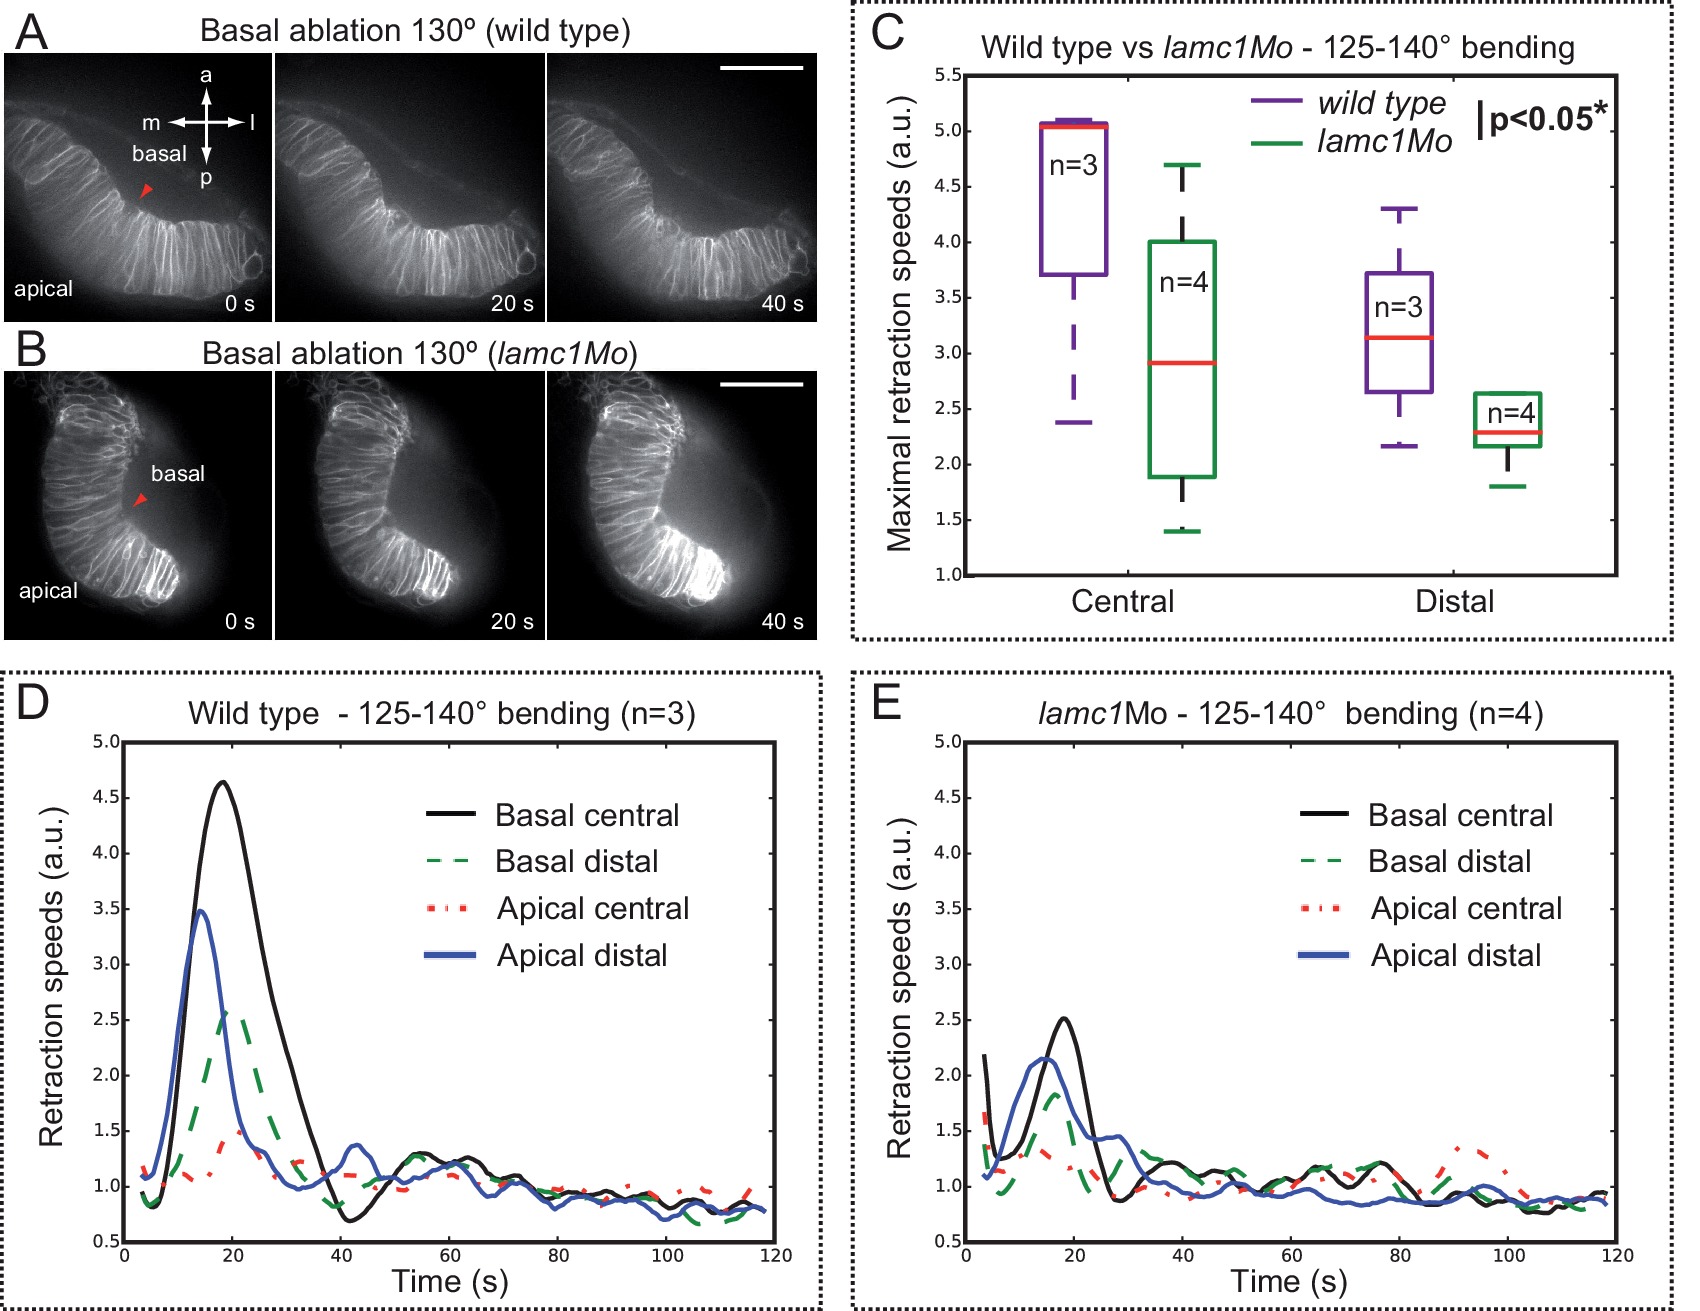
Fig. 8 S3
Optical flow analysis of tissue displacement upon laser ablation in wild type vs. lamc1_Mo tissues.
(A–B) Laser ablation experiments at the basal surface of the retina in wild type (A) and lamc1Mo (B) tissues. Red arrowheads indicate the ablation point. Scale bar = 50 µm. (C) Box plot representation of maximal retraction speeds for control and morphant tissues both at the central and distal (peripheral) retina. For each stage, median values (red bars) and sample sizes are indicated. Two-way ANOVA analysis shows that retraction speeds are significantly reduced in lamc1 morphants (p<0.05*). (D–E) Tissue retraction speed profiles at different retinal positions (color-coded) are represented over time for wild type (D) and lamc1Mo (E).