
Fig. 4
- ID
- ZDB-IMAGE-161201-24
- Publication
- Monroe et al., 2016 - Hearing sensitivity differs between zebrafish lines used in auditory research
- All Figures
- Figures for Monroe et al., 2016
|
Fig. 4
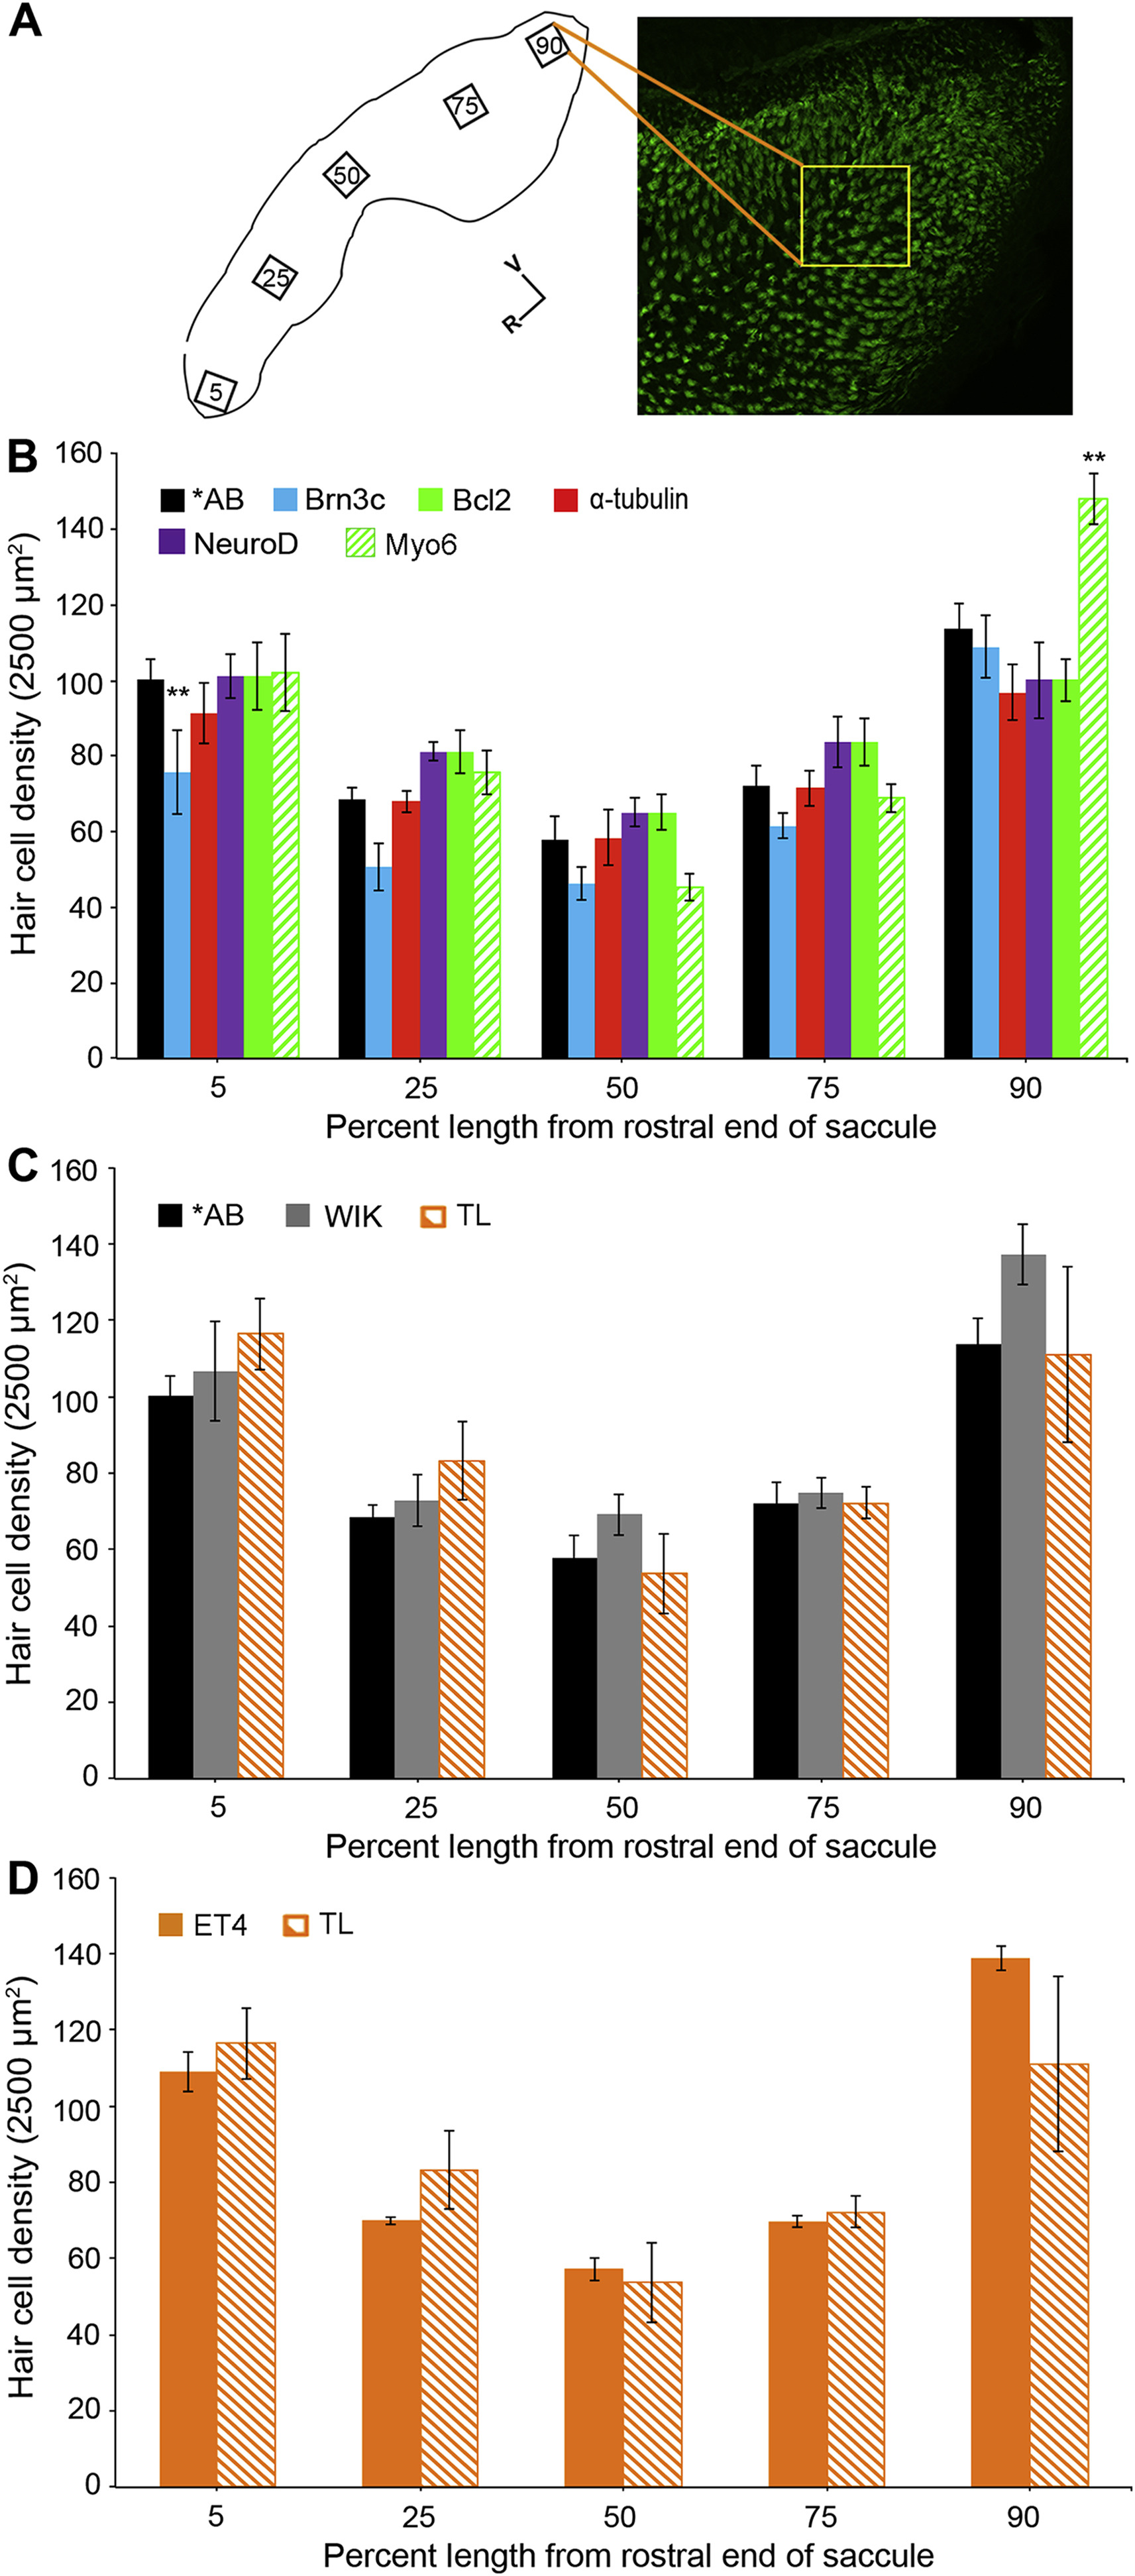
Hair bundle density in the zebrafish saccule. (A) Schematic of the saccular epithelium showing the location of our five sampling regions along the rostral-caudal axis. The confocal image on the right is an example of a phalloidin-labeled saccule. All boxes are 50 × 50 μm and are drawn to scale. V = ventral, R = rostral. (B) Comparison of bundle density in *AB fish and transgenic lines on a *AB background. Hair bundle density significantly differs by genotype and saccular location (2-way ANOVA, F5,225 = 6.88, p < 0.001; and F4,225 = 79.06, p < 0.001, respectively). Bonferroni-corrected posthoc tests were then used to compare each transgenic line to the *AB wildtype fish, where **p < 0.01 indicates significant differences from *AB at that saccular location. (C) There is no significant difference in saccular hair bundle density between wildtype strains (2-way ANOVA, F2,96 = 2.65, p = 0.07). (D) Saccular bundle density does not differ between transgenic ET4 fish and wildtype TL fish (2-way ANOVA, F1,31 = 0.08, p = 0.78). Data are presented as mean ± S.E. N = 4–12 fish per group.
Reprinted from Hearing Research, 341, Monroe, J.D., Manning, D.P., Uribe, P.M., Bhandiwad, A., Sisneros, J.A., Smith, M.E., Coffin, A.B., Hearing sensitivity differs between zebrafish lines used in auditory research, 220-231, Copyright (2016) with permission from Elsevier. Full text @ Hear. Res.