
Fig. 4
- ID
- ZDB-IMAGE-161122-16
- Genes
- Antibodies
- Publication
- Katz et al., 2016 - A Nuclear Role for miR-9 and Argonaute Proteins in Balancing Quiescent and Activated Neural Stem Cell States
- All Figures
- Figures for Katz et al., 2016
|
Fig. 4
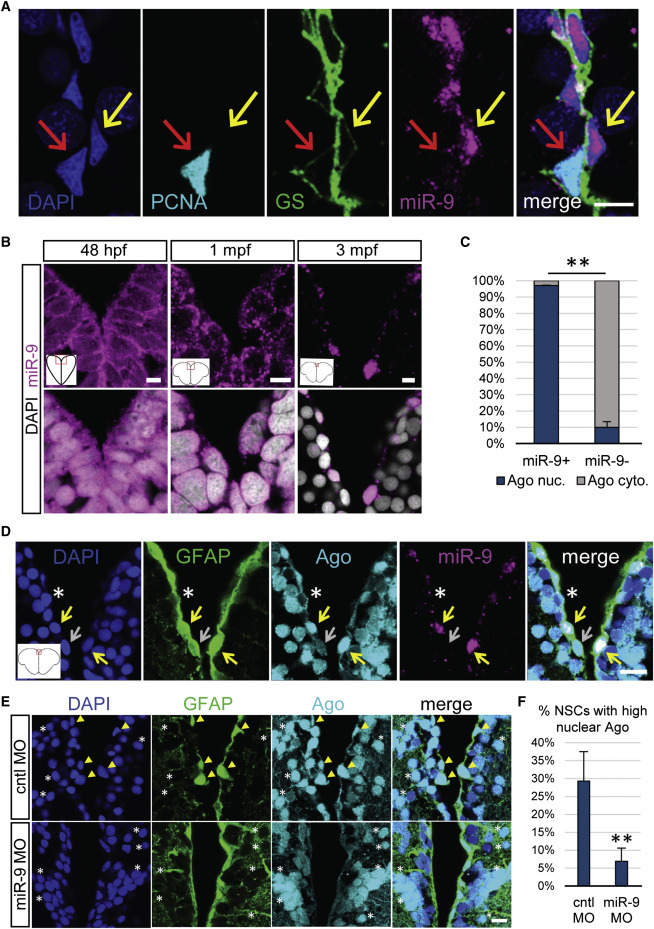
miR-9 Is Nuclear in Mature qNSCs and Is Significantly Associated with the Nuclear Localization of the RISC Effector Ago
(A) Representative image of ISH for miR-9 (magenta) and double immunostaining for PCNA (light blue) and GS (green) with nuclear DAPI counterstaining (dark blue) highlighting the presence of miR-9 in the nucleus of qNSCs (yellow arrow) and not in the nucleus of aNSCs (red arrow). Scale bar, 10 μm.
(B) Sections through the medial region of the dorsal telencephalic ventricle of a 48 hpf embryo, a 1 mpf juvenile, and a 3 mpf adult zebrafish illustrating an ISH of miR-9 (magenta) alone (top) and together with DAPI counterstaining in gray (bottom). Scale bar, 5 μm.
(C) Proportion of cells showing strong nuclear localization of Ago (blue) or mostly cytoplasmic localization of Ago (light gray) in miR-9+ versus miR-9− NSCs populations, illustrating the association between nuclear Ago localization and miR-9 expression.
(D) ISH of miR-9 (magenta) and double fluorescent immunostaining for gfap:GFP (green) and Ago (ab57113, light blue) with nuclear DAPI counterstaining (dark blue). Strong nuclear Ago localization is observed in miR-9+ NSCs (yellow arrows) in contrast to cytoplasmic Ago localization in miR-9− NSCs (white asterisk and gray arrow). Scale bar, 20 μm.
(E) Double fluorescent immunostaining for gfap:GFP (green) and Ago (light blue) with nuclear DAPI counterstaining (dark blue) in conditions of miR-9 kd (bottom) when compared to controls (top). NSCs with strong nuclear Ago staining (yellow arrowheads) are lost in miR-9 MO-treated brains, while the nuclear signal for Ago in neuronal cells is not affected by miR-9 kd (white asterisks). Scale bar, 10 μm.
(F) Quantification of the percentage of NSCs displaying a strong nuclear Ago signal 2 dpi of the control or miR-9 vivoMO. ∗∗p < 0.01; one-way ANOVA with Bonferroni post hoc correction. Data are represented as mean ± 95% CI; n = 3 brains per condition.