
Fig. 1
- ID
- ZDB-IMAGE-161122-13
- Genes
- Antibodies
- Publication
- Katz et al., 2016 - A Nuclear Role for miR-9 and Argonaute Proteins in Balancing Quiescent and Activated Neural Stem Cell States
- All Figures
- Figures for Katz et al., 2016
|
Fig. 1
Dynamic Expression of miR-9 in qNSCs
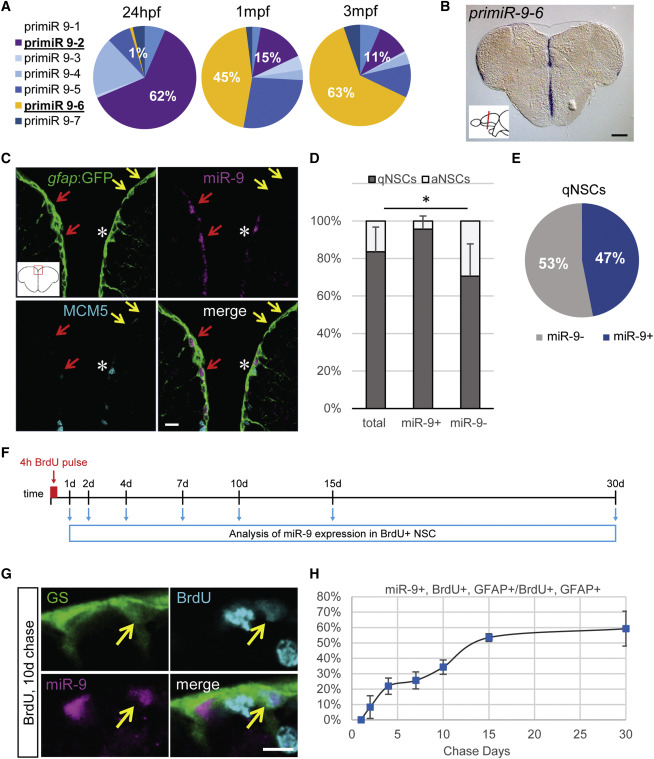
(A) qRT-PCR analysis of the seven miR-9 transcripts in 48 hr post-fertilization (hpf) embryos, 1 month post-fertilization (mpf) juvenile brains, and 3 mpf adult brains with the expression of each transcript over the sum expression of all transcripts.
(B) ISH against pri-miR-9-6 on a cross-section of the telencephalon illustrating its expression restricted to the ventricular region (blue). Scale bar, 100 μm.
(C) Sections through the medial region of the dorsal telencephalon showing ISH with a mature miR-9 LNA probe (magenta) and double fluorescent immunostaining for gfap:GFP (green) and MCM5 (light blue). miR-9 expression is restricted to qNSCs (gfap+, MCM5−; red arrows) and never observed in aNSCs (gfap+, MCM5+; white asterisk). Some qNSCs are devoid of miR-9 signal (yellow arrows). Scale bar, 10 μm.
(D) Proportion of qNSCs (gfap+, MCM5−; dark gray) and aNSCs (gfap+, MCM5−; light gray) in the total, miR-9+ or miR-9− NSC population demonstrating that miR-9 expression is associated with quiescence.
(E) Percentage of qNSCs that are miR-9+ or miR-9−.
(F) Experimental design to assess miR-9 expression dynamics across the NSCs activation/quiescence cycle.
(G) Representative image of BrdU+ (light blue), miR-9+ (pink), and GS+ (green) NSC 10 days after BrdU pulse. Scale bar, 5 μm.
(H) Percentage of miR-9+ cells among BrdU+ NSCs after different chase period. ∗p < 0.05; one-way ANOVA with Bonferroni post hoc correction. Data are represented as mean ± 95% confidence interval (CI); n = 3 brains per condition.