
Image
|
Figure Caption
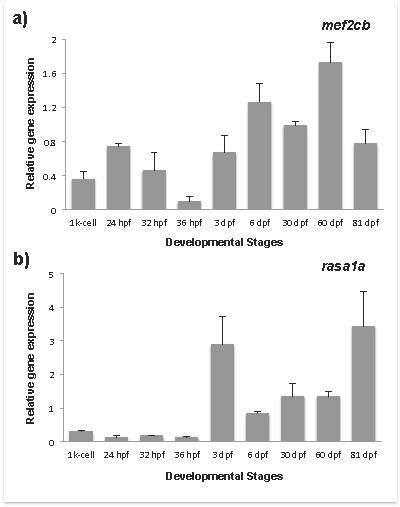
Fig. S4
Analysis of mef2cb and nfi1a expression during zebrafish development. qPCR analysis was performed using RNA samples from several stages of zebrafish development, and normalized to levels of zebrafish EF1α. Values are the mean of at least 3 independent replicates; hpf indicates hours post-fertilization; dpf indicates days post-fertilization.
Figure Data
Acknowledgments
This image is the copyrighted work of the attributed author or publisher, and
ZFIN has permission only to display this image to its users.
Additional permissions should be obtained from the applicable author or publisher of the image.
Reprinted from Gene, 566(1), Roberto, V.P., Tiago, D.M., Gautvik, K., Cancela, M.L., Evidence for the conservation of miR-223 in zebrafish (Danio rerio): Implications for function, 54-62, Copyright (2015) with permission from Elsevier. Full text @ Gene