
Fig. 6
- ID
- ZDB-IMAGE-161116-37
- Publication
- Torraca et al., 2015 - The CXCR3/CXCL11 signaling axis mediates macrophage recruitment and dissemination of mycobacterial infection
- All Figures
- Figures for Torraca et al., 2015
|
Fig. 6
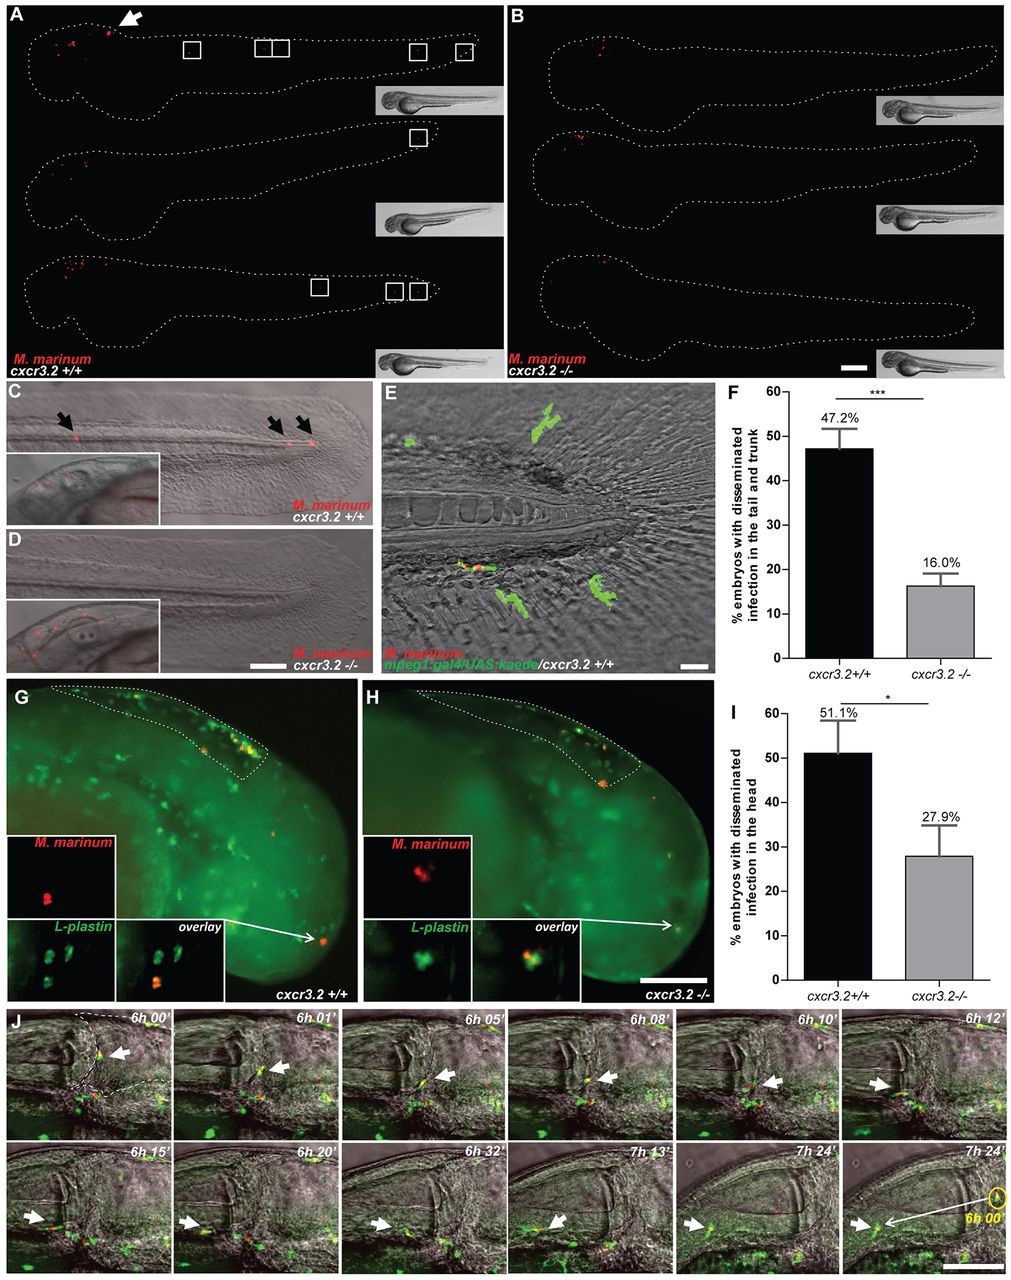
Effect of cxcr3.2 mutation on dissemination of local mycobacterial infection within 24 hpi. (A,B) Representative images of cxcr3.2+/+ and cxcr3.2−/− embryos with local and disseminated mycobacterial infection. Embryos were infected at 30 hpf by injecting 200 CFU of M. marinum into the hindbrain and images were taken at 24 hpi (54 hpf). In cxcr3.2+/+ embryos, single infected cells are visible distally from the infection (white boxes). Scale bar: 200 μm. (C–E) Details of distal infection emerging from hindbrain infection. The black arrows (C) point at single M. marinum-infected cells, present in the tail of a cxcr3.2+/+ fish at 24 hpi but notably absent in the example of a cxcr3.2−/− fish (D). Particulars of the infected hindbrains of the same embryos are shown in the boxed inserts on the left, indicating similar levels of local infection. Use of the Tg(mpeg1:gal4/UAS:kaede) line (E) shows that the infection disseminated from the hindbrain resides in macrophages in cxcr3.2+/+. Scale bars in C and D: 100 μm; scale bar in E: 20 μm. (F) Quantification of M. marinum infection dissemination in the trunk and tail in cxcr3.2+/+ and cxcr3.2−/− embryos. Embryos were scored positive for dissemination if one or more infected macrophages were observed in the trunk or tail region. The graph demonstrates a significant difference in the total percentage of embryos showing infection dissemination at 24 hpi. Data were accumulated from three independent experiments. Sample size (n): 125, 172. Error bars: mean±s.e.m. (G–I) Quantification of M. marinum infection dissemination in the head in cxcr3.2+/+ and cxcr3.2−/− embryos. Representative figures of cxcr3.2 wild-type (wt; G) and mutant (H) embryos and quantification (I) of dissemination in the head at 6 hours post M. marinum infection in the hindbrain. Embryos were scored positive for dissemination if one or more infected macrophages were observed outside the hindbrain limits (dotted line). Insets in G and H show details of infected macrophages outside the hindbrain. The graph in I demonstrates a significant difference in the total percentage of embryos showing infection dissemination at this time point. Arrows in the figures point at the particular of a disseminated infection. Sample size (n): 47, 43. Error bars: mean±s.e.m. Scale bar: 200 μm. (J) Time course of a M. marinum-infected macrophage egressing from the hindbrain. The image sequence (taken from a cxcr3.2+/+ embryo) represents over a time course of ~1.5 hours that macrophages (green) can facilitate the dissemination of M. marinum (red) that is locally delivered in the hindbrain ventricle. The dashed line in the first image represents the hindbrain limits and arrow points at an infected macrophages adhering to the hindbrain boundary. In the subsequent images the arrow points at the infected macrophage egressing from the hindbrain. The yellow circle in the last image of the sequence contains an inset of the infected macrophage from the first image to represent its initial position (6 hpi) compared with its position at the end of the image sequence (~7.5 hpi). Scale bar: 100 μm. *P<0.05; ***P<0.001.