
Fig. 4
- ID
- ZDB-IMAGE-161111-3
- Genes
- Antibodies
- Publication
- de Peralta et al., 2016 - Cnbp ameliorates Treacher Collins Syndrome craniofacial anomalies through a pathway that involves redox-responsive genes
- All Figures
- Figures for de Peralta et al., 2016
|
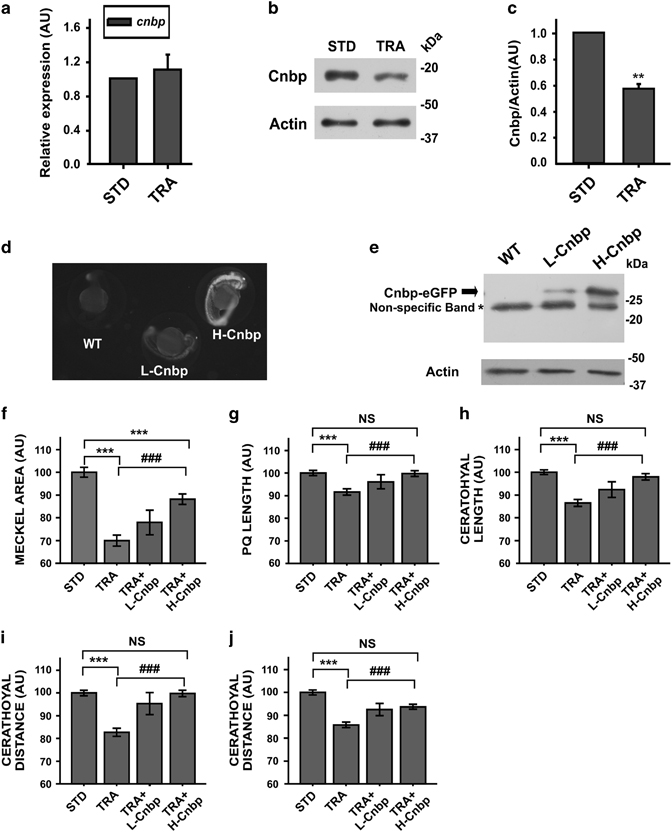
Fig. 4
TCS-like phenotype is ameliorated in cnbp-overexpressing transgenic zebrafish. (a) Relative abundance of cnbp mRNA determined by RT-qPCR using total RNA from 24 hpf zebrafish control (STD) and TRA-embryos. Bars represent mean of relative abundances and S.E.M., n=3 AU: arbitrary units. (b) Western blotting analysing cnbp expression in 24 hpf embryos microinjected with TRA-MO. Controls were injected with STD-MO. Actin detection was used as a loading control. (c) Densitometric analysis of Cnbp normalized to Actin. The bars are means±S.E.M. of three experiments. n=5, **P<0.01 (t-test) (d) Fluorescence images of wild-type (WT) and transgenic zebrafish Tg(XIa.Eefiai:cnbpa-EGFP) lines (L-Cnbp and H-Cnbp). (e) Levels of Cnbp-eGFP detected by western blotting in 24 hpf transgenic zebrafish embryos by using anti-GFP antibodies. (*) Non-specific bands. Actin was assessed as a loading control. (f–j) Bar charts representing the quantification of craniofacial parameters measured in controls (STD), wild-type tcof1-knockdown larvae (TRA) and transgenic tcof1-knockdown larvae overexpressing low (TRA+L-Cnbp) or high (TRA+H-Cnbp) levels of Cnbp. (f) Meckel Area, (g) PQ length, (h) Ceratohyal length; (i) CD, (j) Cr. In TRA+L-Cnbp larvae, only the CD was restored (P<0.05 versus TRA and not different from STD), the Meckel area was indistinguishable from TRA and the rest of parameters showed in-between statistics (not displayed). Bars represent means in AU and S.E.M. n=47 for STD, n=79 for TRA, n=15 for TRA+L-Cnbp, n=36 for TRA+H-Cnbp. ***P<0.001 versus STD, ###P<0.001 versus TRA NS=non-significant P>0.05 (t-test)