
Fig. 4
- ID
- ZDB-IMAGE-161104-48
- Genes
- Publication
- Song et al., 2014 - Systematic transcriptome analysis of the zebrafish model of diamond-blackfan anemia induced by RPS24 deficiency
- All Figures
- Figures for Song et al., 2014
|
Fig. 4
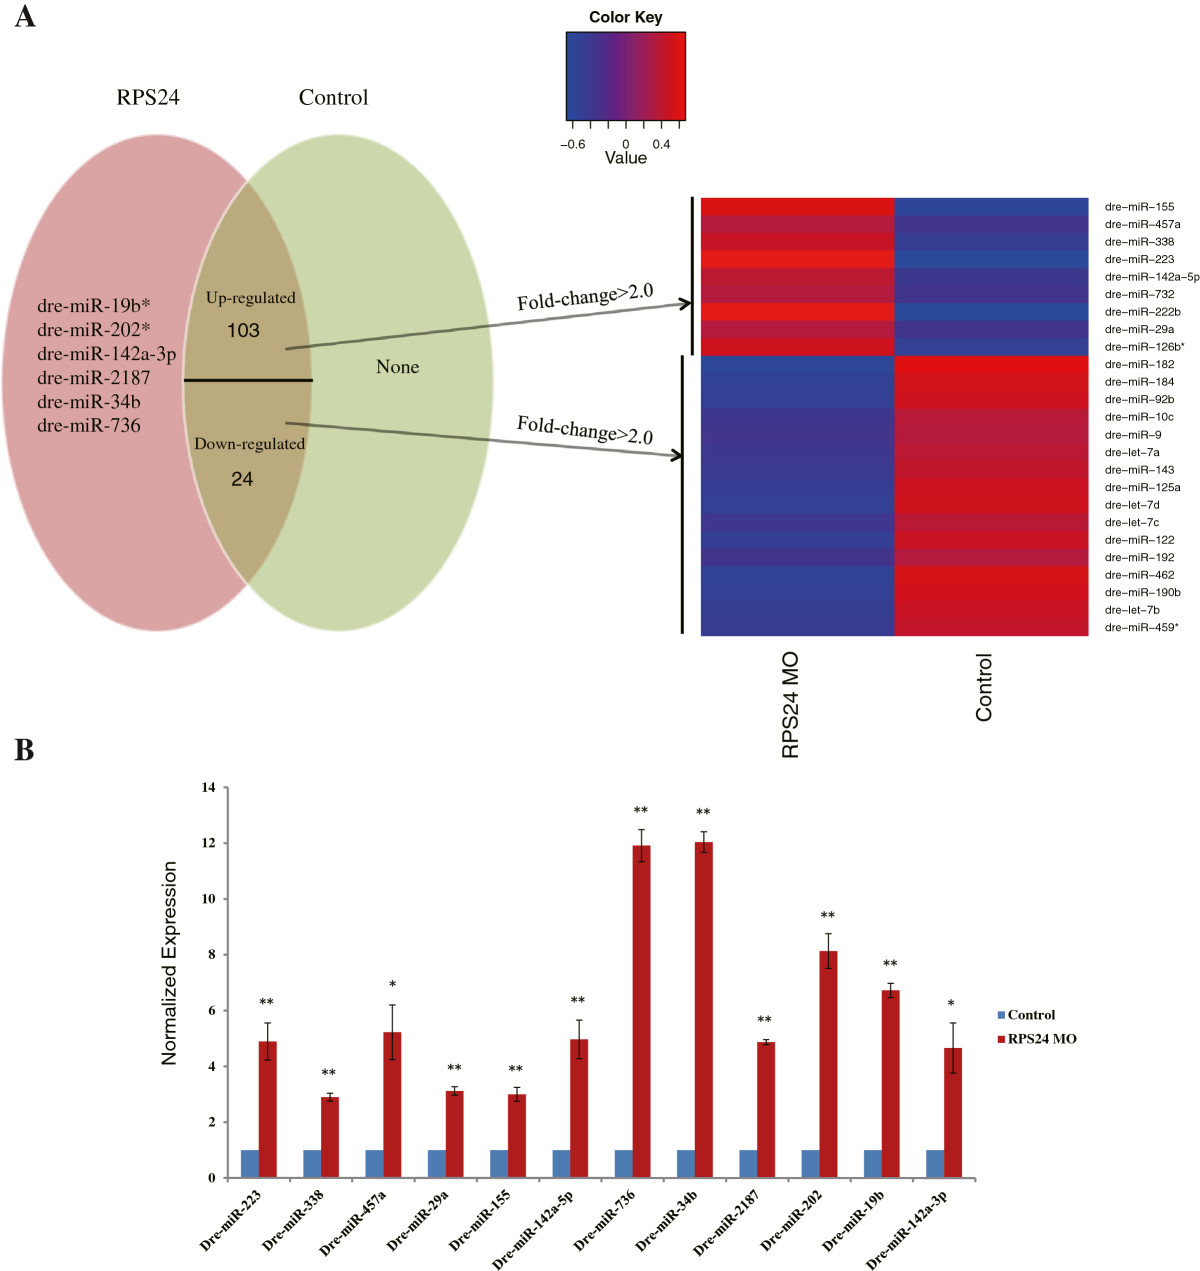
Differentially regulated known miRNAs. (A) Specific expressed miRNAs in RPS24 and Control are represented in the form of Venn diagrams. A subset of miRNAs that are differentially regulated by fold-change >2.0 and p-value <0.05 is in the overlapped area and their normalized expression levels can be seen in the heat map. (B) Representative experimental validation of the regulated miRNAs by Real-time PCR analysis. Gene expression was represented as the mean ± SD and One-way ANOVA was performed for comparison between Control and RPS24-deficient zebrafish embryos (**P <0.001, *P <0.01, n = 3). Gene expression in Control samples was normalized to 1.