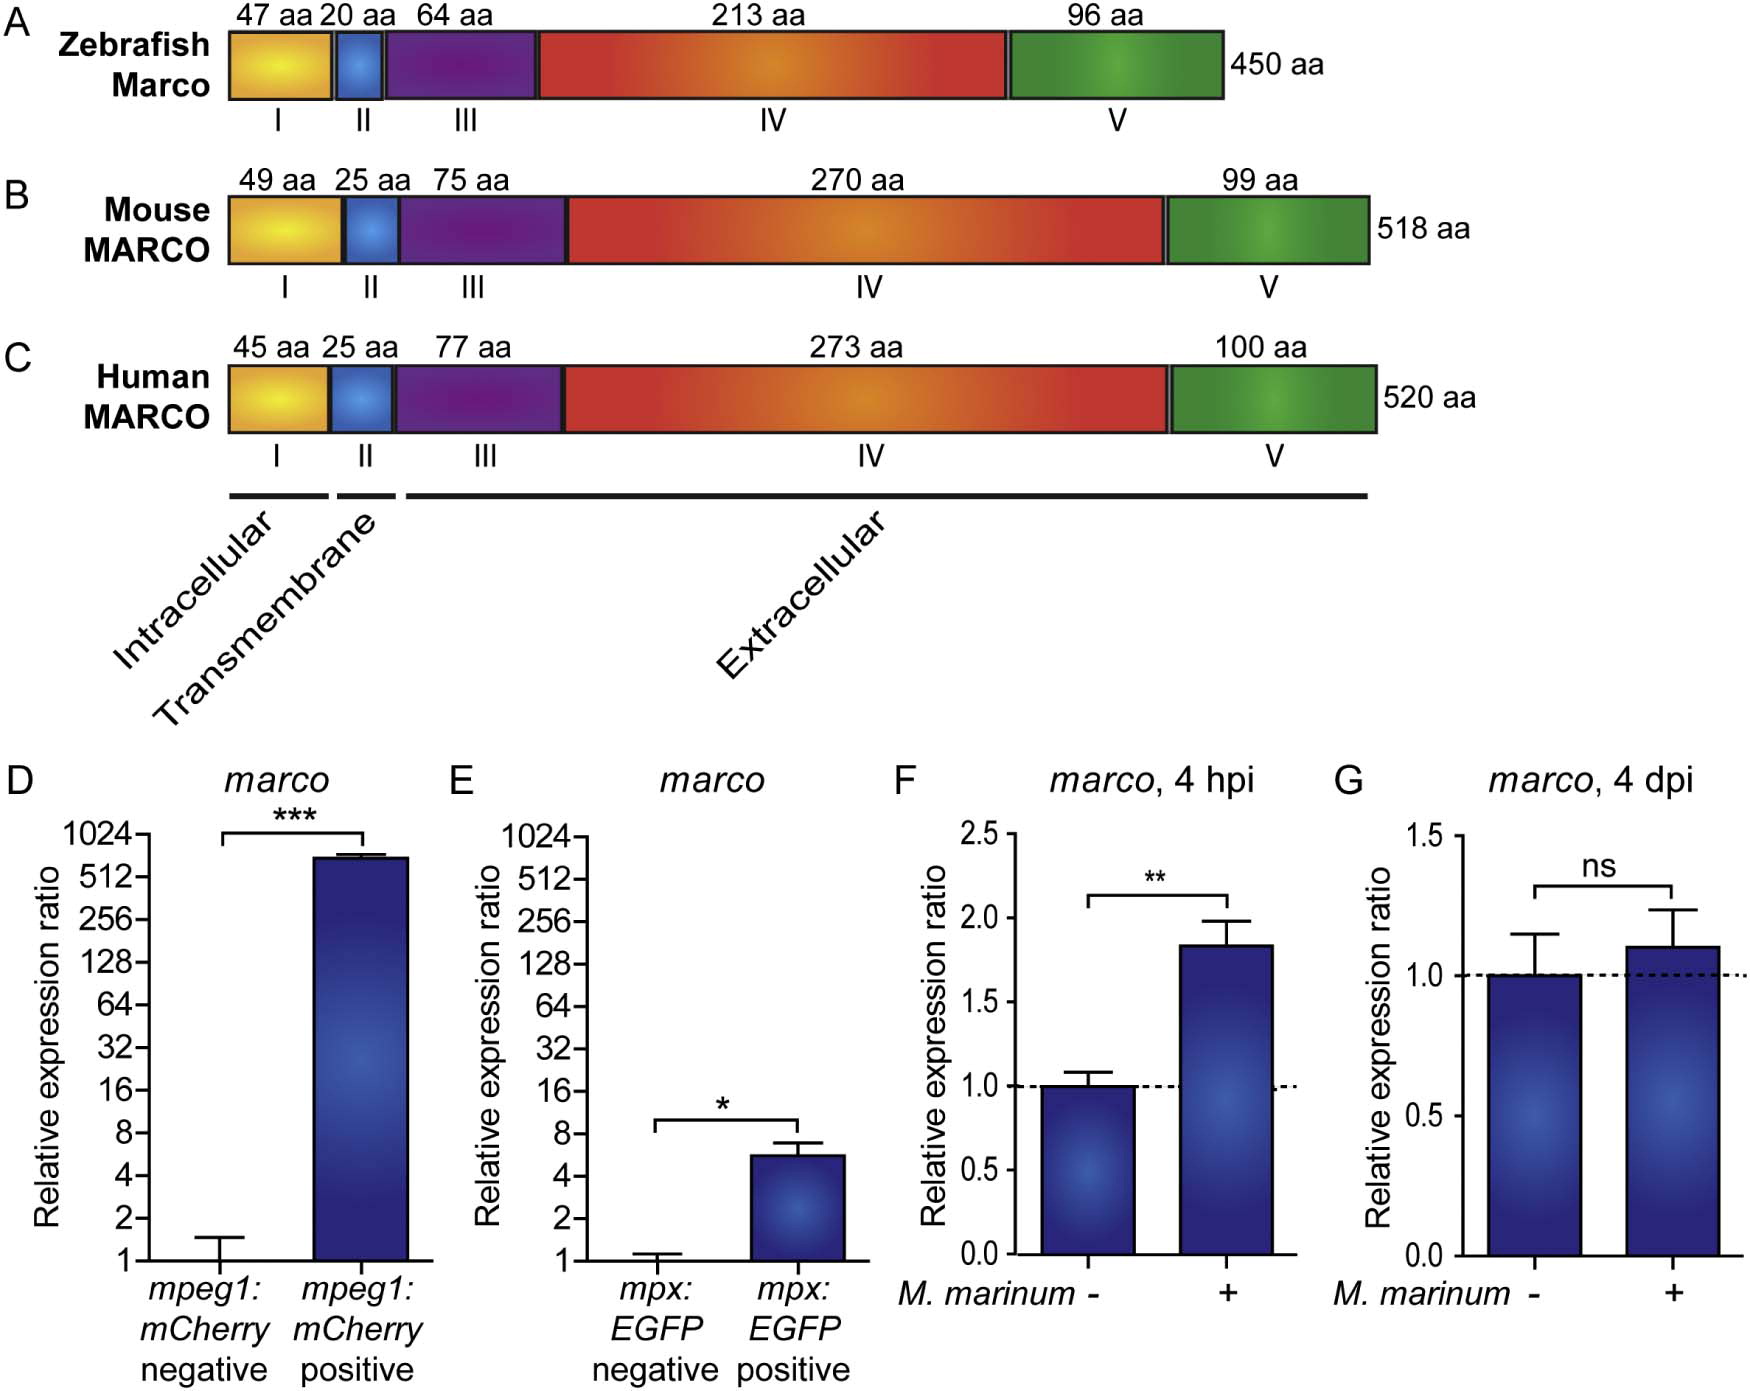
Fig. 1
Zebrafish marco encodes a macrophage specific protein with conserved domains and is induced during early M. marinum infection. Comparison of the predicted (A) zebrafish Marco protein structures with (B) murine and (C) human MARCO. The cytoplasmic domain (I), transmembrane domain (II), short spacer domain (III), collagenous domain (IV), and C-terminal cysteine-rich domain (V) are conserved domains detected by SMART analysis. The domains are indicated by Roman numbers; the amino acid (aa) residue lengths of the subunit chains are indicated above their corresponding domains; and the total protein lengths are indicated to the right. The predicted cellular location of each region is indicated below. (D-E) Zebrafish marco is expressed in macrophages. Expression of marco in (D) macrophages and (E) neutrophils. qPCR analysis was performed on RNA from fluorescence-positive cell fractions obtained by cell sorting of 6 dpf larvae transgenic reporter lines for macrophages (Tg(mpeg1:mCherry)) and neutrophils (Tg(mpx:EGFP)). Expression was compared against the fluorescence-negative cell fraction of each transgenic line. (F-G) marco is up-regulated during early M. marinum infection. qPCR analysis was performed on RNA from (F) 4 hpi and (G) 4 dpi mock injected and M. marinum (200 cfu) injected AB/TL embryos. All graphs show data combined from three biological replicates (n = 15 per group, pooled per replicate).

