
Fig. 2 S2
- ID
- ZDB-IMAGE-161103-37
- Publication
- Perez-Camps et al., 2016 - Quantitative imaging reveals real-time Pou5f3-Nanog complexes driving dorsoventral mesendoderm patterning in zebrafish
- All Figures
- Figures for Perez-Camps et al., 2016
|
Fig. 2 S2
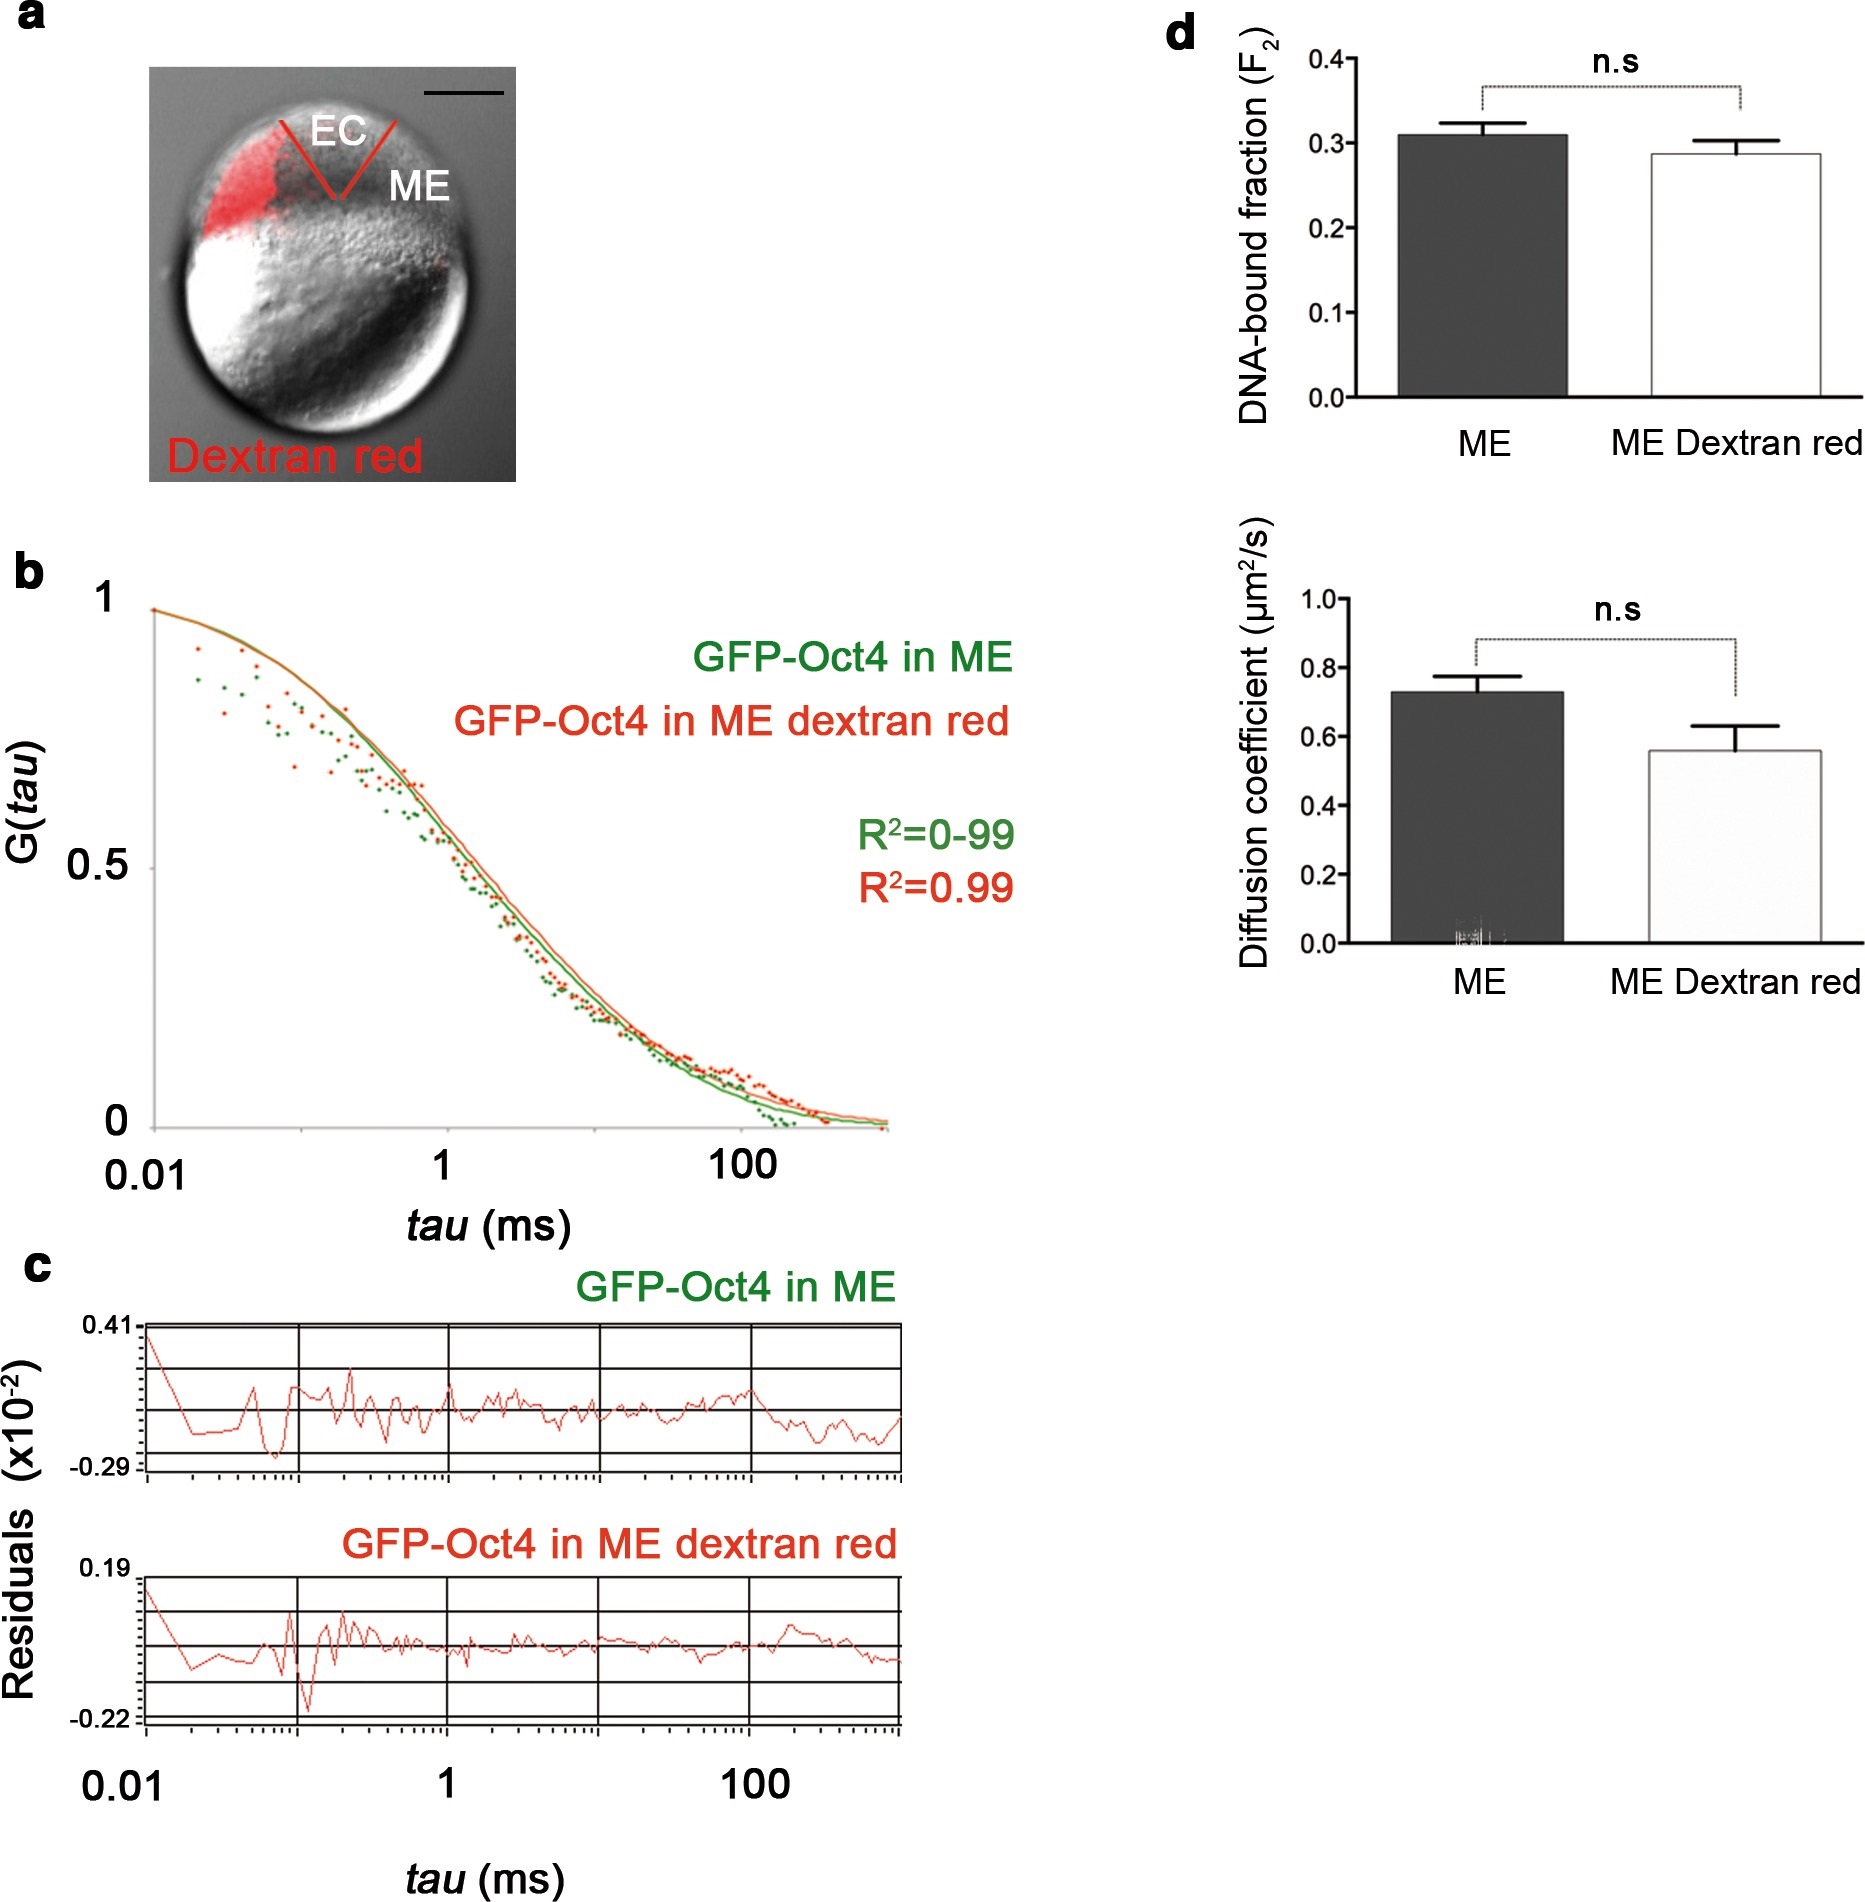
Dextran red does not interfere in the FCS measurements.
(a) Embryo (oblong stage; 3.5 hpf) showing mesendoderm (ME) labeled by dextran (red) leaving the ectoderm (EC) unlabeled. Scale bar: 200 µm. (b) ACF of the intensity traces of GFP-Oct4 in ME cells labeled or unlabeled. FCS data were fit by two-component anomalous diffusion model. (c) Raw data of residuals from fit curves shown in b. (d) DNA-bound fraction and diffusion coefficient derived from the FCS measurements in b. Values represent mean ± SEM of data from three independent experiments (n = 40-100 cell nuclei from 10 to 15 embryos). n.s. over bars indicates non-significant differences.