
Fig. 2 S1
- ID
- ZDB-IMAGE-161103-36
- Publication
- Perez-Camps et al., 2016 - Quantitative imaging reveals real-time Pou5f3-Nanog complexes driving dorsoventral mesendoderm patterning in zebrafish
- All Figures
- Figures for Perez-Camps et al., 2016
|
Fig. 2 S1
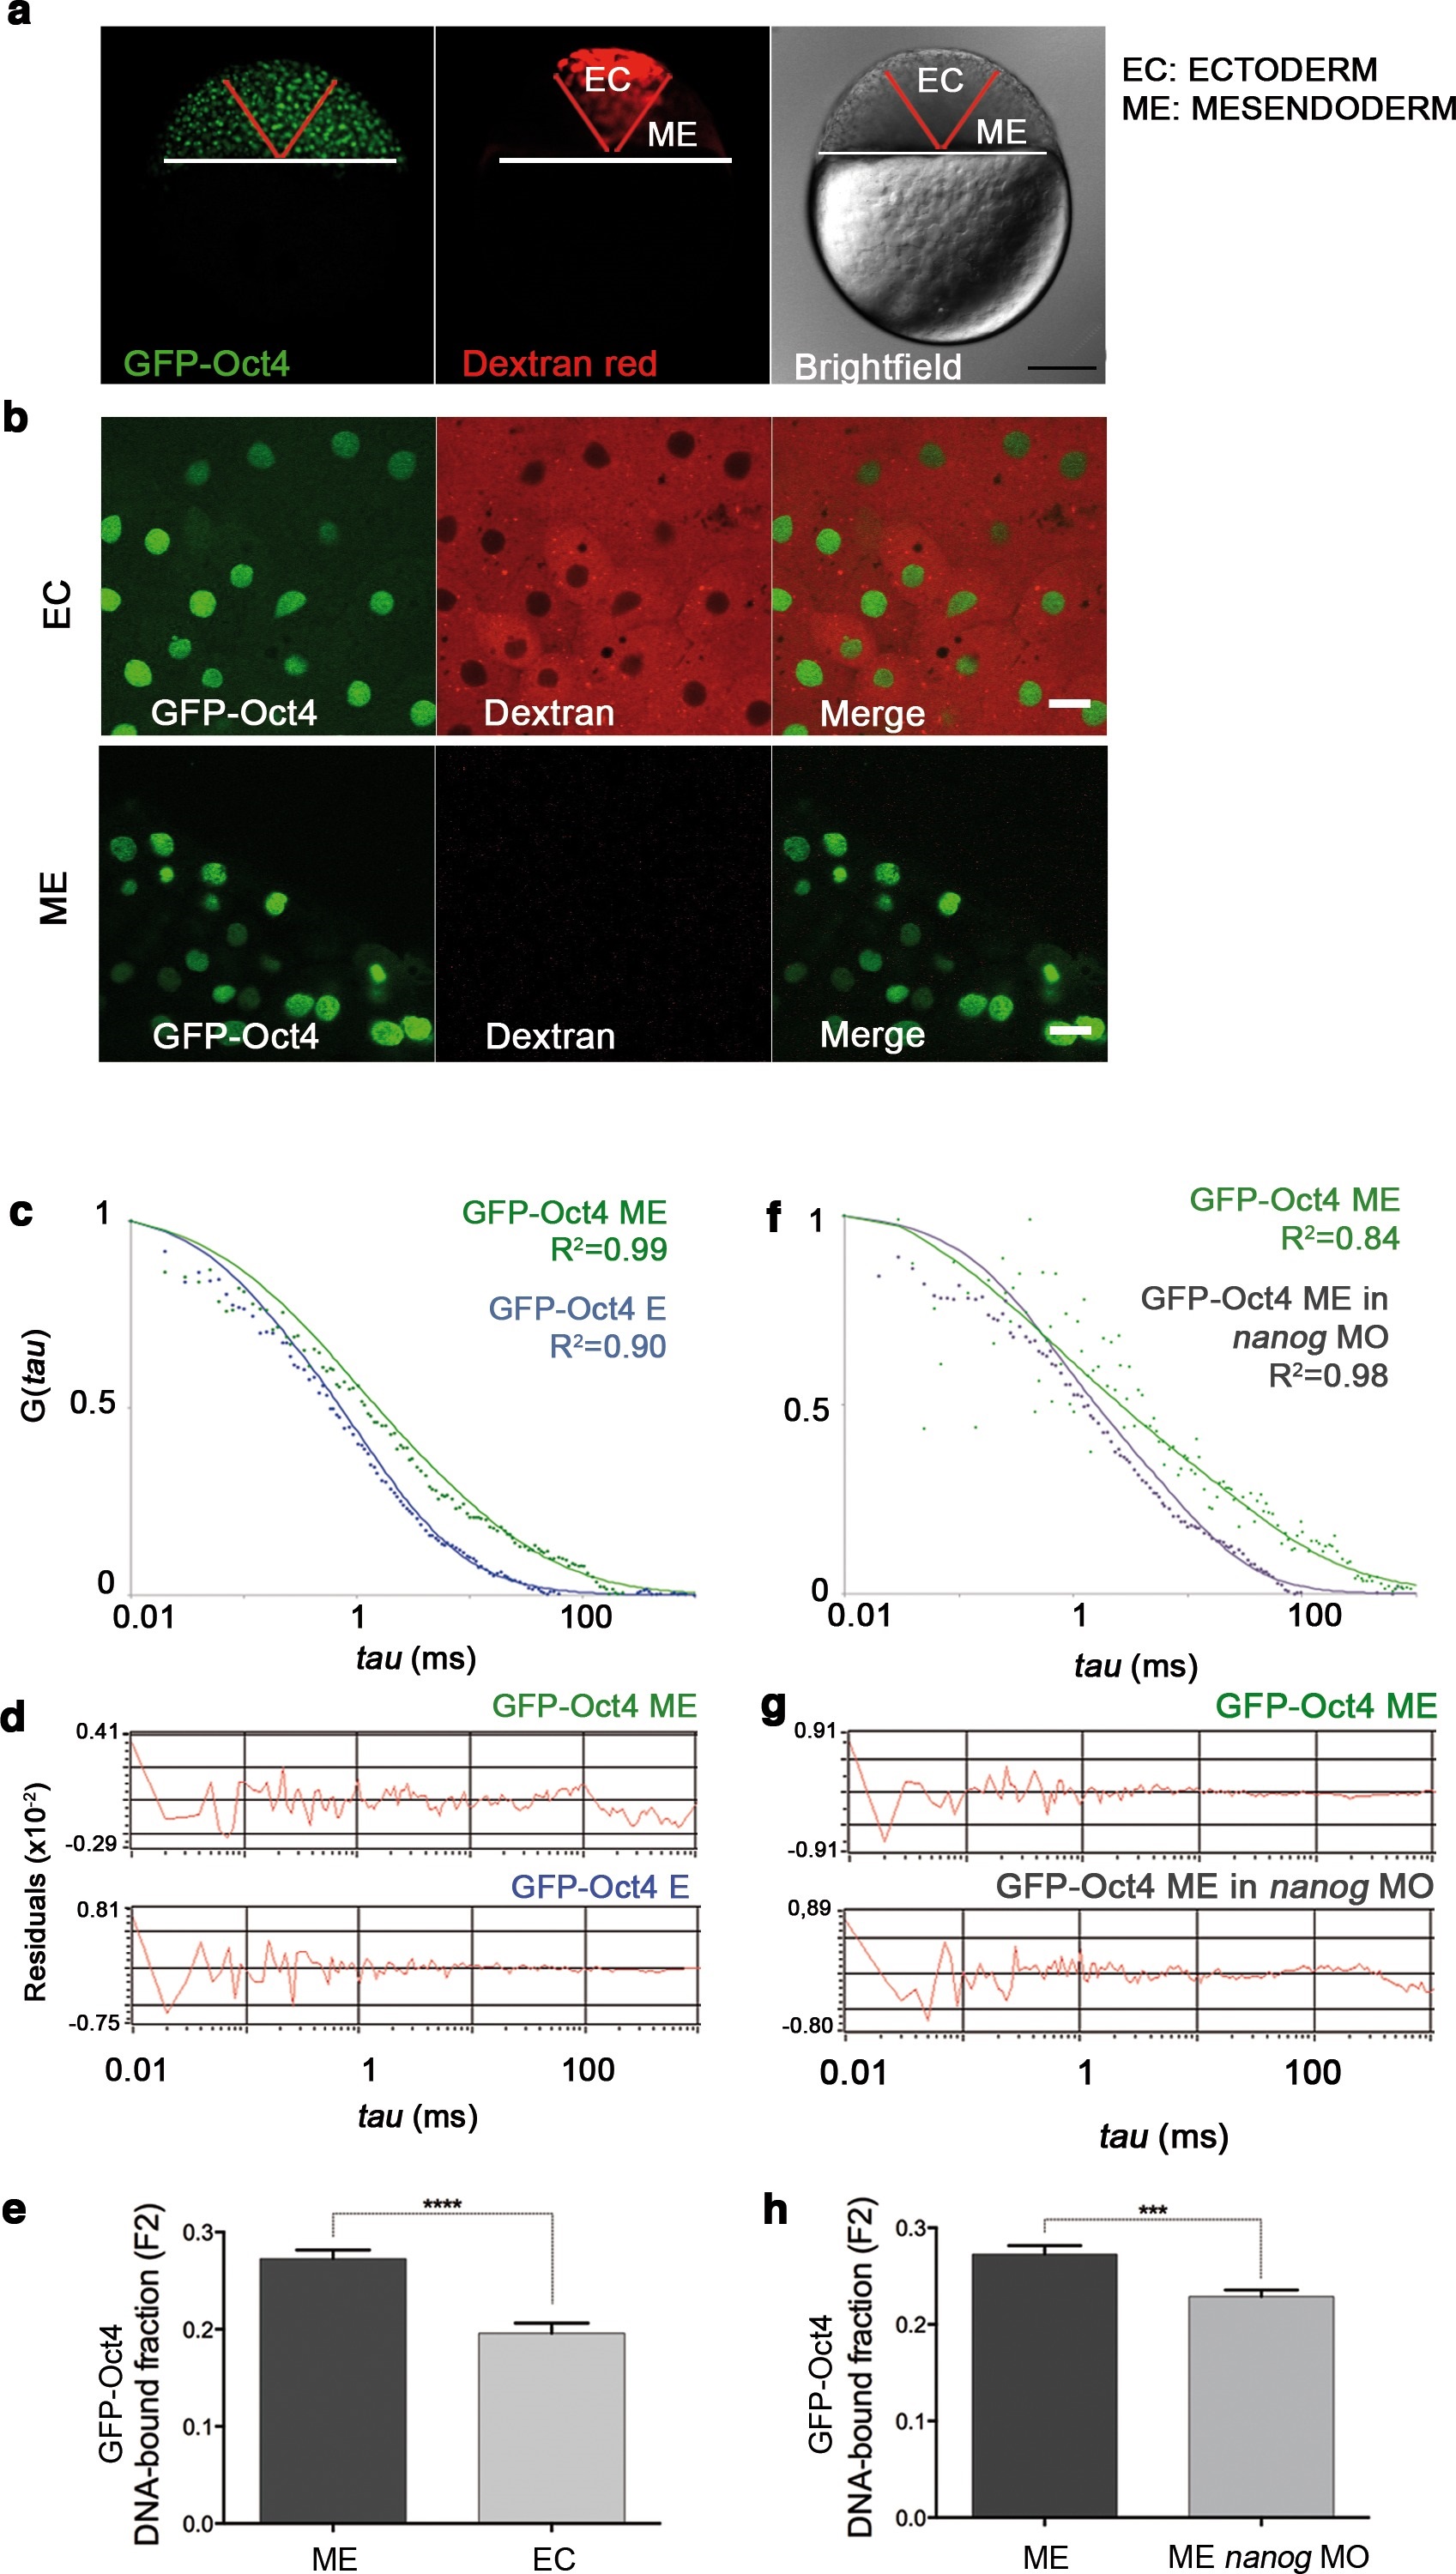
GFP-Oct4 dynamics in blastula embryos.
(a) GFP-Oct4 expressed in the blastoderm at the blastula stage (oblong; 3.5 hpf). Ectoderm (EC) cells are traced by dextran red; non-labeled cells are mesendoderm (ME). Scale bar: 200 µm. (b) Cells from the blastoderm expressing GFP-Oct4. Staining as in a. Scale bar: 20 µm. (c) ACF of the intensity traces of GFP-Oct4 in EC and ME in wild-type embryos. The ACF were fit by two-component anomalous diffusion model. Curves are normalized to compare differences in protein activity. (d) Raw data of residuals from fit curves shown in c. (e) DNA-bound fraction derived from the previous ACFs. Values represent the mean ± SEM of data from three to five independent experiments (n > 60 cell nuclei from 10 to 15 embryos; ****p<0.0001). (f) ACF of the intensity traces of GFP-Oct4 in nanog morphant embryos. The ACF were fit by two-component anomalous diffusion model. Curves are normalized to compare differences in protein activity. (g) Raw data of residuals from fit curves shown in f. (h) DNA-bound fraction derived from the previous ACFs. Values represent the mean ± SEM of data from three to five independent experiments (n > 60 cell nuclei from 10 to 15 embryos; ***p<0.001). See also Figure 2-source data 1