
Image
|
Figure Caption
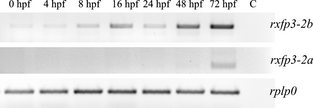
Fig. 1
Reverse transcription-polymerase chain reaction (RT-PCR) on rxfp3-2a and rxfp3-2b transcripts during zebrafish embryogenesis. Temporal expression pattern of zebrafish rxfp3-2a and rxfp3-2b at different embryonic stages indicated on top as hours post fertilization. Amplification of rplp0 cDNA was a control of RT–PCR sensitivity in the assay. C indicates the negative PCR control reaction lacking cDNA template.
Figure Data
Acknowledgments
This image is the copyrighted work of the attributed author or publisher, and
ZFIN has permission only to display this image to its users.
Additional permissions should be obtained from the applicable author or publisher of the image.
Full text @ Dev. Growth Diff.