
Image
|
Figure Caption
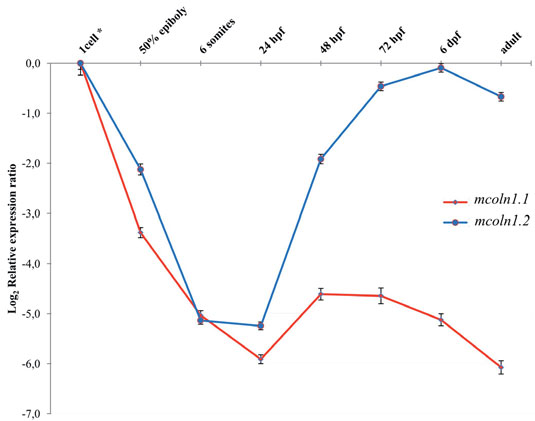
Fig. 8
Real Time PCR expression analysis of mcoln1.1 and mcoln1.2 genes throughout Danio rerio development. All reactions were run in triplicate. The relative expression levels, represented as the mean(SEM in log2 scale, were determined with respect to the 1-cell stage and normalized to elongation factor 1α (ef1α).
Figure Data
Acknowledgments
This image is the copyrighted work of the attributed author or publisher, and
ZFIN has permission only to display this image to its users.
Additional permissions should be obtained from the applicable author or publisher of the image.
Full text @ Int. J. Dev. Biol.