
Image
|
Figure Caption
Fig. 2
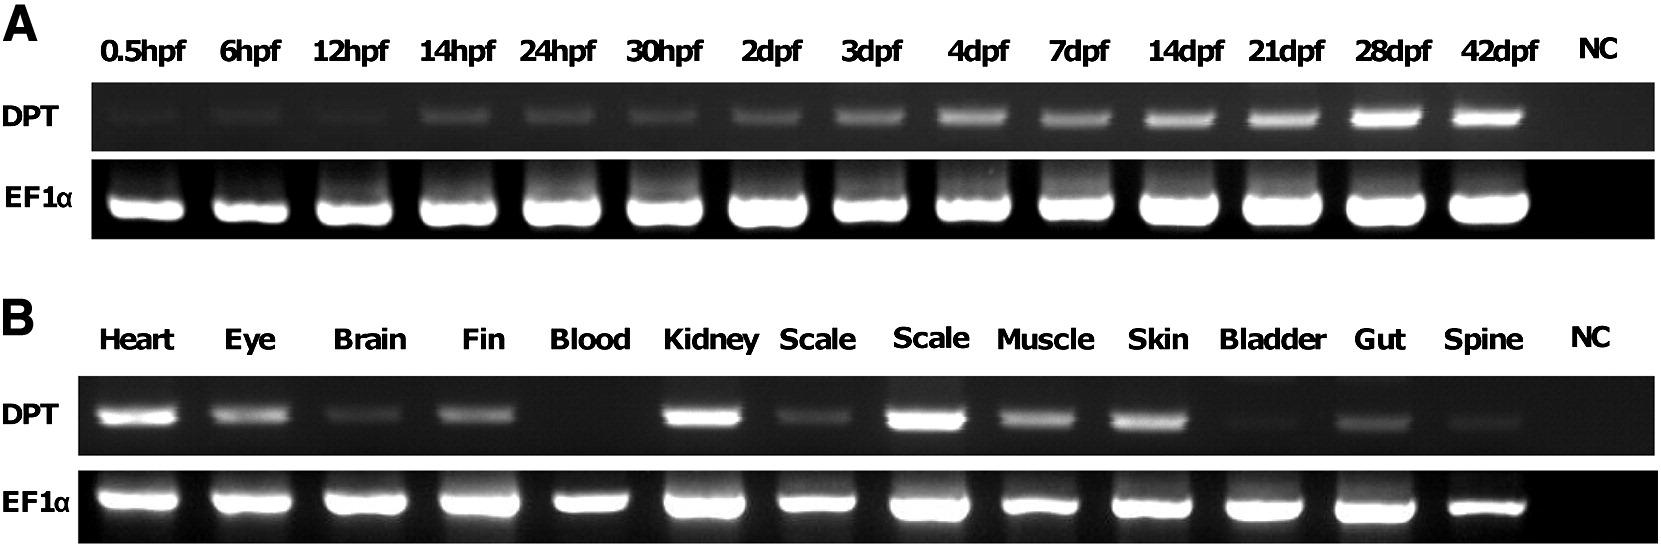
Reverse-transcription polymerase chain reaction (RT-PCR) analysis in the development of zebrafish embryos and adult tissues. (A) RT-PCR analysis was performed using RNA extracted from zebrafish embryos 0.5, 6, 12, 14, 24, and 30 hpf, and 2, 3, 4, 7, 14, 21, 28, and 42 dpf. (B) Expression of DPT in various adult tissues. Expression of EF1± served as an internal control. NC, negative control (RNase free water).
Figure Data
Acknowledgments
This image is the copyrighted work of the attributed author or publisher, and
ZFIN has permission only to display this image to its users.
Additional permissions should be obtained from the applicable author or publisher of the image.
Reprinted from Gene, 516(2), Tan, Y., Iimura, K., Sato, T., Ura, K., and Takagi, Y., Spatiotemporal expression of the dermatopontin gene in zebrafish Danio rerio, 277-284, Copyright (2013) with permission from Elsevier. Full text @ Gene