
Fig. 4
- ID
- ZDB-IMAGE-161027-36
- Publication
- Middel et al., 2016 - Dysferlin-mediated phosphatidylserine sorting engages macrophages in sarcolemma repair
- All Figures
- Figures for Middel et al., 2016
|
Fig. 4
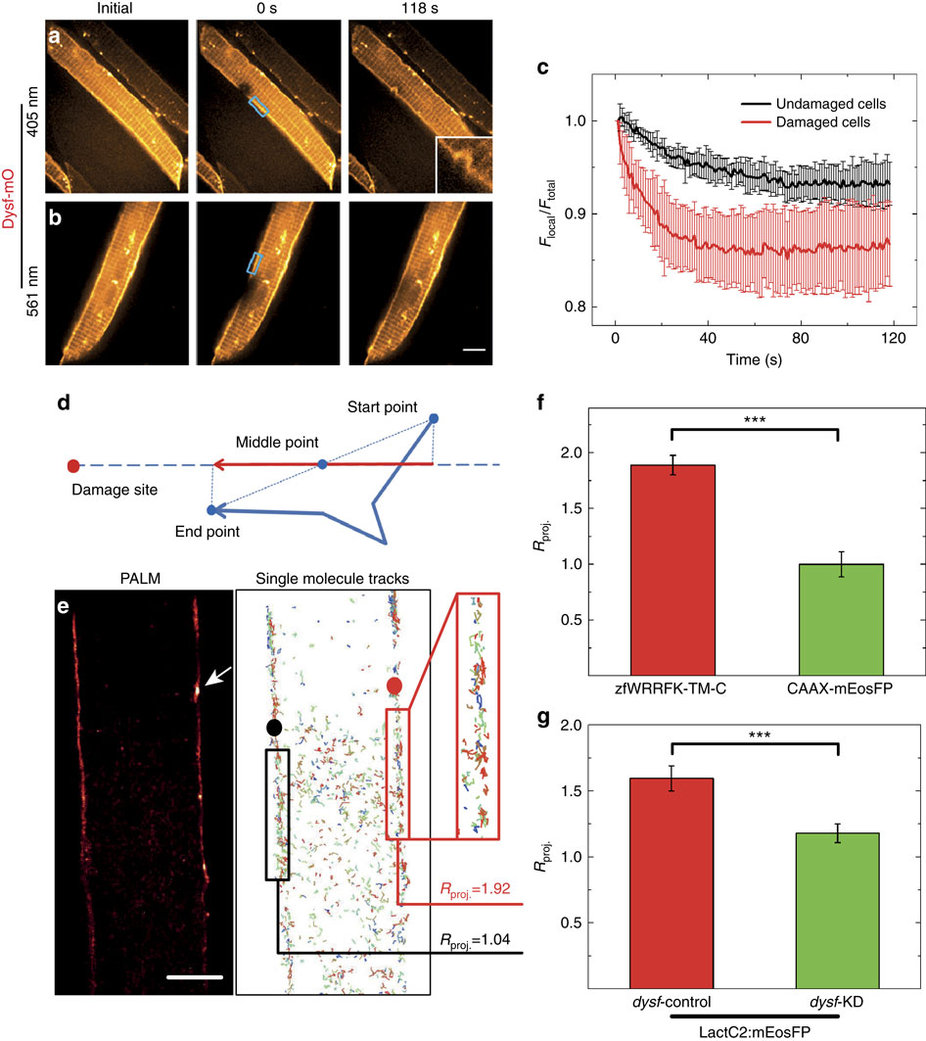
Dysf facilitates PS translocation to site of lesion.
(a-c) Fluorescence loss in photobleaching (FLIP) analysis on selected regions (blue boxes in a,b) of live Dysf-mO expressing myofibers. (a) Photobleaching and membrane damaging using 405 nm laser; (b) photobleaching only using 561 nm laser. (c) 561-nm irradiation results in an intensity decrease by 6% (black curve); 405-nm irradiation results in a more rapid decrease by 14% (red curve). (d-g) Single-molecule trajectory analysis of zfWRRFK-TM-C and controls after sarcolemmal damage. (d) Scheme showing the projection of a single-molecule trajectory onto the line connecting the midpoint with the site of damage. (e) Super-resolution localization image of a mEosFP:zfWRRFK-TM-C labelled myofiber. The arrow indicates the site of lesion. Single-molecules trajectories calculated from the image data in e. Molecules near the lesion (red box) show a high tendency (Rproj.=1.92) to move towards the lesion (red dot). In the undamaged sarcolemma (left), trajectories (black box) did not show directed motion towards the black dot (Rproj.=1.04). (f) mEosFP:zfWRRFK-TM-C moved towards the lesion (red column); the control CAAX-mEosFP did not (green column; P<10-8). (g) The PS sensor LactC2:mEosFP moved towards the lesion in dysf-contr-KD embryos (red column) but not in dysf-KD embryos (green column; Student t-test P<10-8). n≥ 8. Scale bar, 5 µm.