
Fig. S6
- ID
- ZDB-IMAGE-161027-34
- Publication
- Middel et al., 2016 - Dysferlin-mediated phosphatidylserine sorting engages macrophages in sarcolemma repair
- All Figures
- Figures for Middel et al., 2016
|
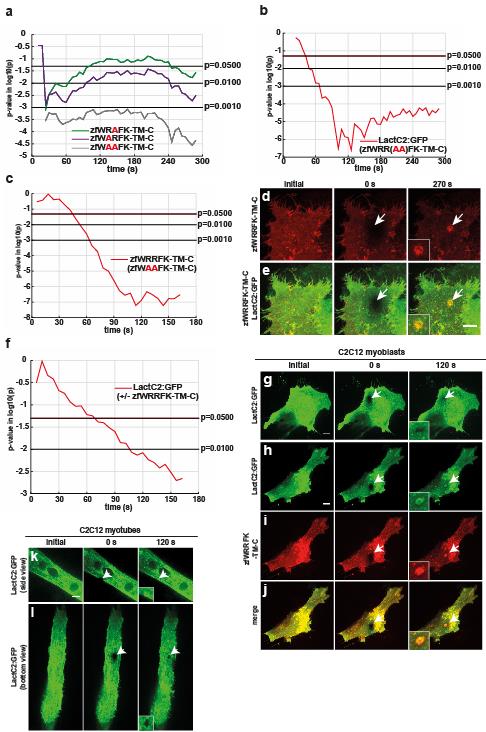
Fig. S6
Two arginines within the zfWRRFK motif of Dysf are essential for PS and Dysf accumulation.
a, Significance was tested comparing wild type constructs (zfWRRFK-TM-C) with single arginine to alanin substituted mutant constructs zfWRAFK-TM-C (green) and zfWARFK-TM-C (purple). The latter shows significant differences to the control throughout the whole imaging time, whereas zfWRAFK-TM-C showed significant differences in the first 100 s and turned again significant after 240 s. A double alanin mutant construct (zfWAAFK-TM-C, grey) showed significant disparity to the control throughout the whole imaging time. b, Significance was tested for LactC2:GFP enrichment at the lesion between co-injections of LactC2:GFP and zfWRRFK-TM-C or LactC2:GFP and zfWAAFK-TM-C. Significant disparity can be seen from 40 s until the end of imaging (red). c, Significance blot of HeLa cells either transfected with zfWAAFK-TM-C or zfWRRFK-TM-C. The latter accumulates significantly more from 45 s onwards (red). d-e, HeLa cells were co-transfected with LactC2:GFP (see Fig. 5g) and zfWRRFK-TM-C-mCherry. The damaged site is indicated by white arrows. Cells were imaged initially , directly after damage (0 s) and after 270 s. Accumulation of zfWRRFK-TM-C-mCherry was observed (d, inlay) and co-localization with LactC2:GFP is indicated by the yellow repair patch (e, inlay). Panels in e are merged images of d and Fig. 5g. f, After 70 s enrichment of PS at the membrane wound in co-transfected (LactC2:GFP and zfWRRFK-TM-C) cells differs significantly from single transfected (LactC2:GFP) cells (red). g-j, undifferentiated C2C12 myoblasts transfected with LactC2:GFP alone and imaged before 0 s (arrow) and 120 s after lesioning (arrow) showed no PS accumulation but only baseline recovery (i, arrow, inset). In the presence of zfWRRFK-TM-C, LactC2:GFP accumulated in the repair patch (j-l, arrows, insets). k-l, differentiated C2C12 myotubes (k, side view; l, bottom view) expressing LactC2:GFP only and imaged before 0 s (arrow) and 120 s after lesioning (arrow) showed PS enrichment at the lesion site (i, arrow, inset). Note: Experiments used to test significance (zfWRRFK-TM-C) in chart a are the same as used in Supplementary Fig. 3g. Significance was tested using MATLAB software. In charts (a-c and f) the two sided Welch’s t-Test with Bonferroni correction was performed. Scale bars: 10 µm.