
Fig. 3
- ID
- ZDB-IMAGE-161020-80
- Publication
- Chong et al., 2012 - STARS Is Essential to Maintain Cardiac Development and Function In Vivo via a SRF Pathway
- All Figures
- Figures for Chong et al., 2012
|
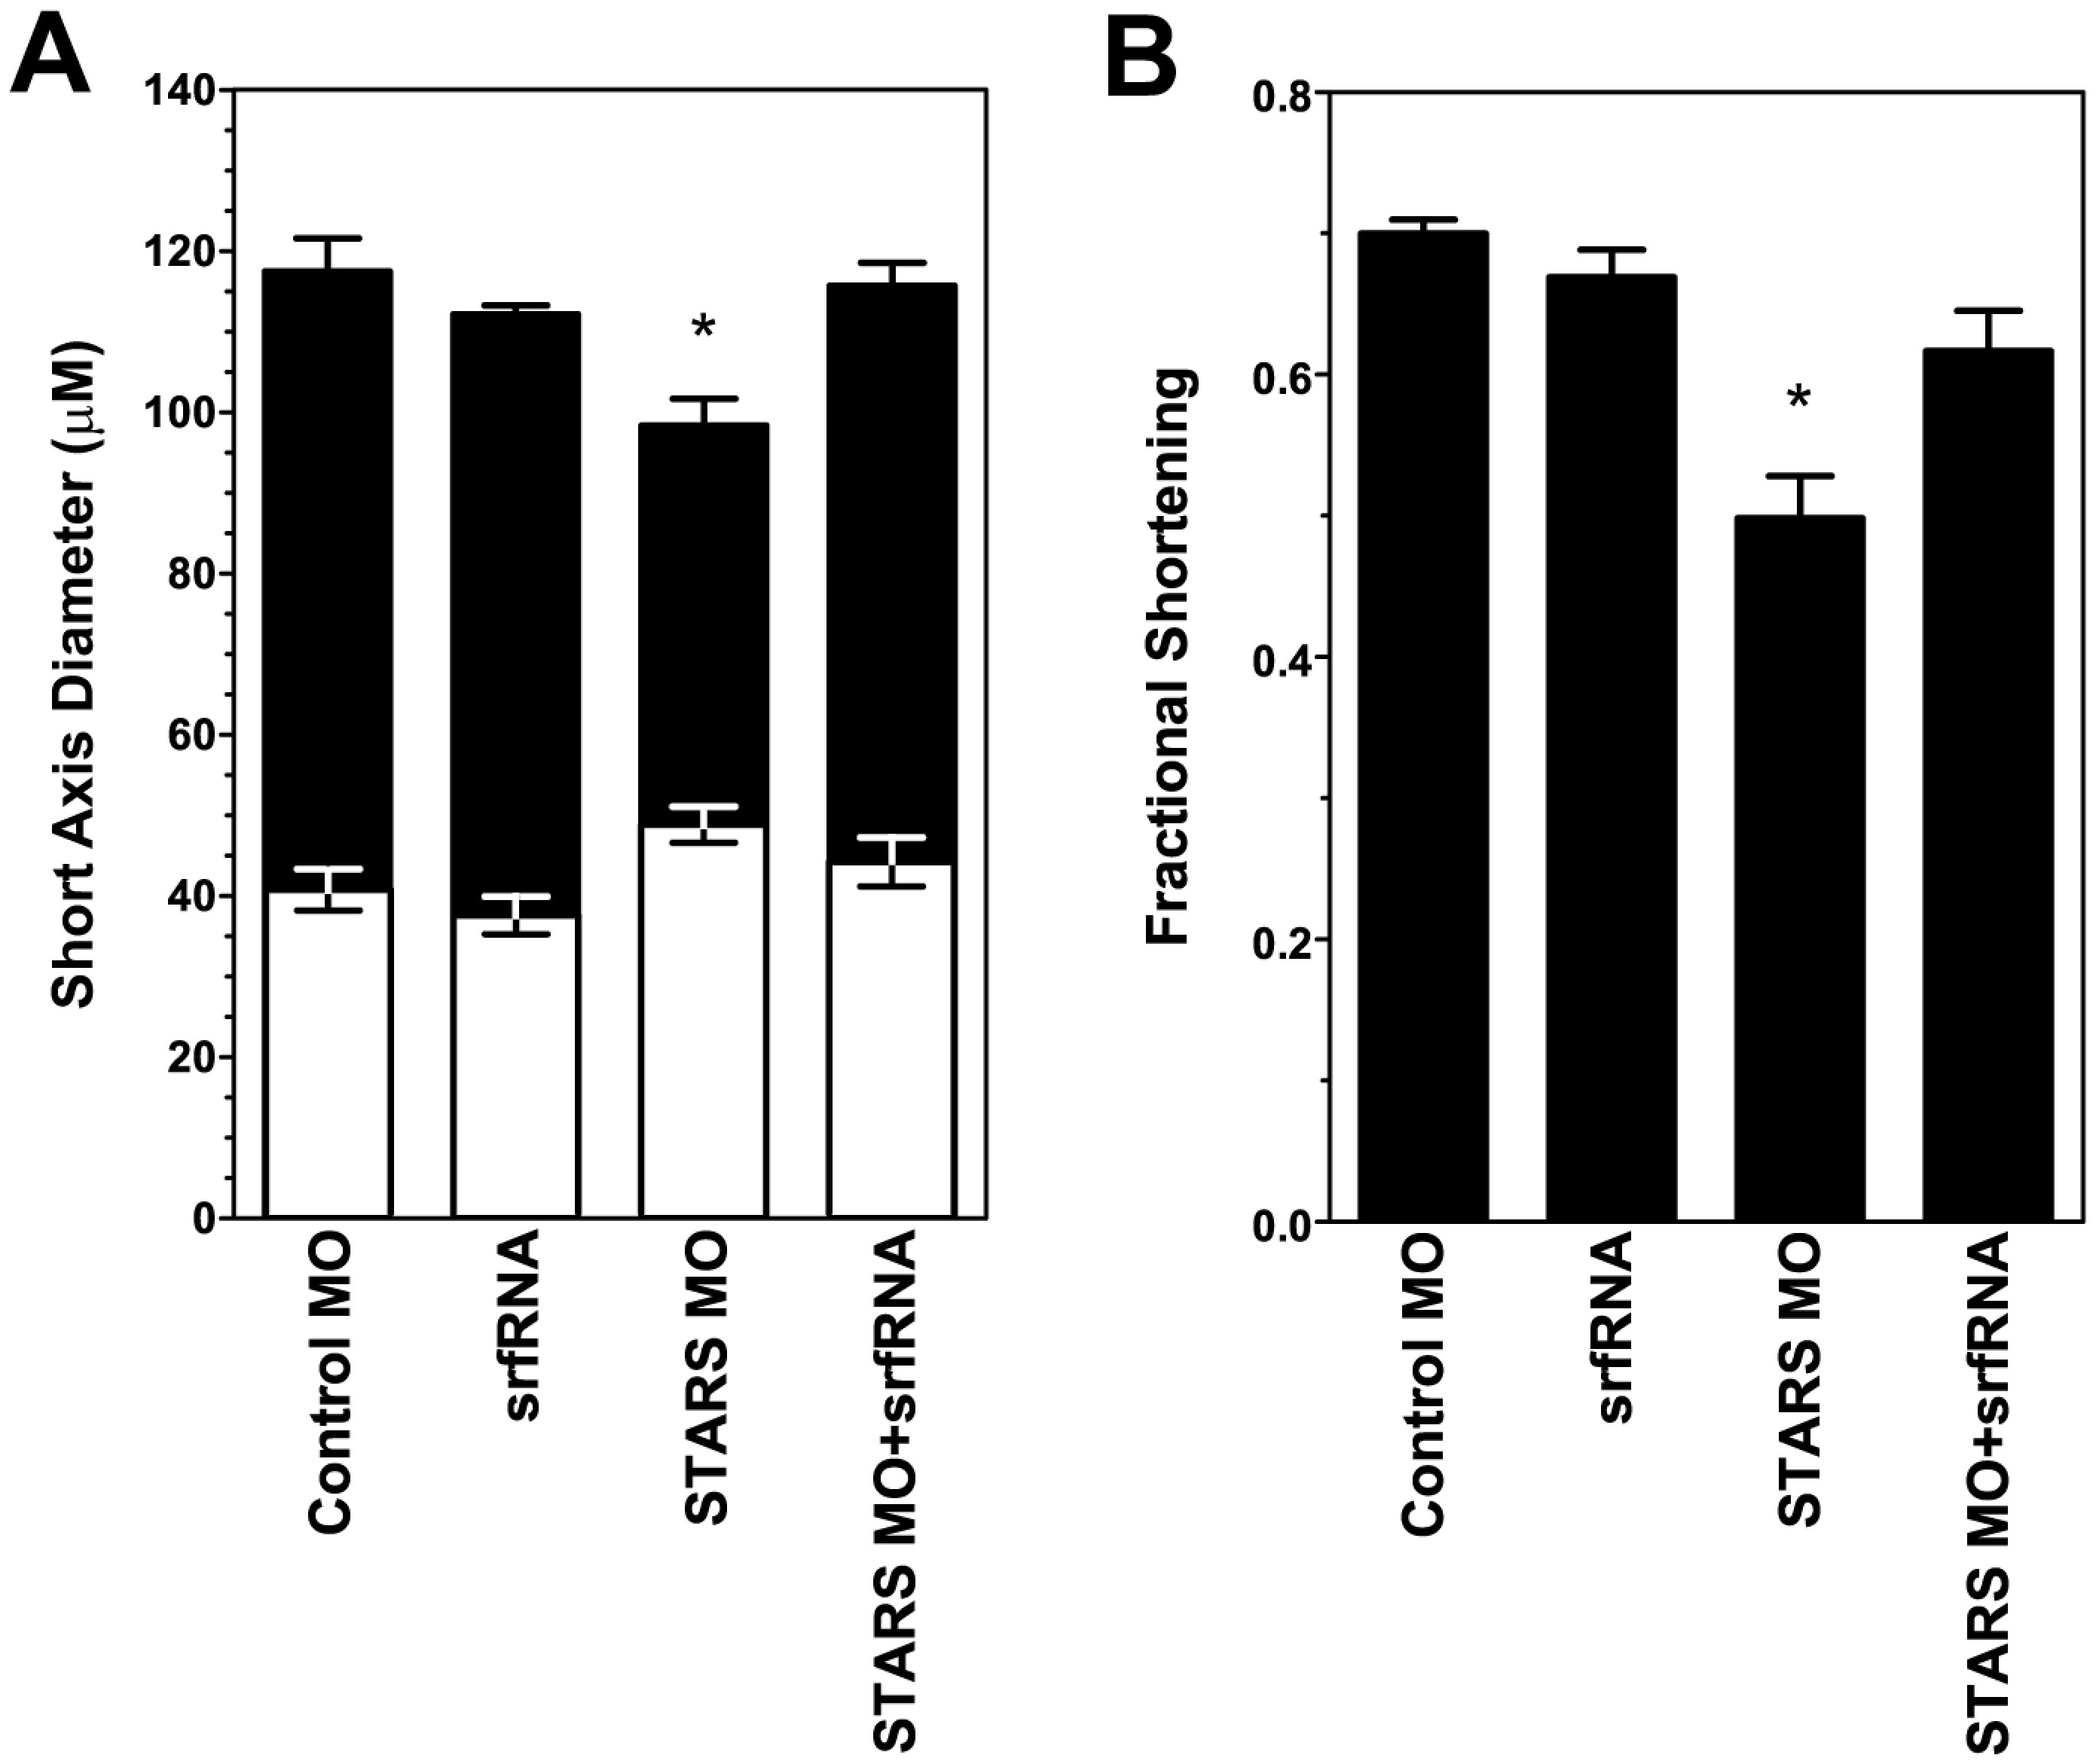
Fig. 3
Ventricular function and dimensions based on quantitative analysis of high-speed video microscopy.
A. Ventricular dimensions at end-diastole (black bars) and end-systole (white bars). Conditions are identical to those in part a. Values plotted are mean (n = 4 embryos) ± standard deviation. Asterisk (*) denotes statistically significant difference by ANOVA. B. Ventricular fractional shortening observed after injection of: control mismatched morpholino (MM MO), zSTARS morpholino + srf mRNA (MO + SRF), srf mRNA only (SRF only), or zSTARS morpholino only (MO only). Values plotted are mean (n = 4 embryos) ± standard deviation. Asterisk (*) denotes statistically significant difference by ANOVA.