
IMAGE
Fig. 10
- ID
- ZDB-IMAGE-161020-50
- Publication
- Lin et al., 2011 - Reverse Effect of Mammalian Hypocalcemic Cortisol in Fish: Cortisol Stimulates Ca Uptake via Glucocorticoid Receptor-Mediated Vitamin D(3) Metabolism
- All Figures
- Figures for Lin et al., 2011
Image
|
Figure Caption
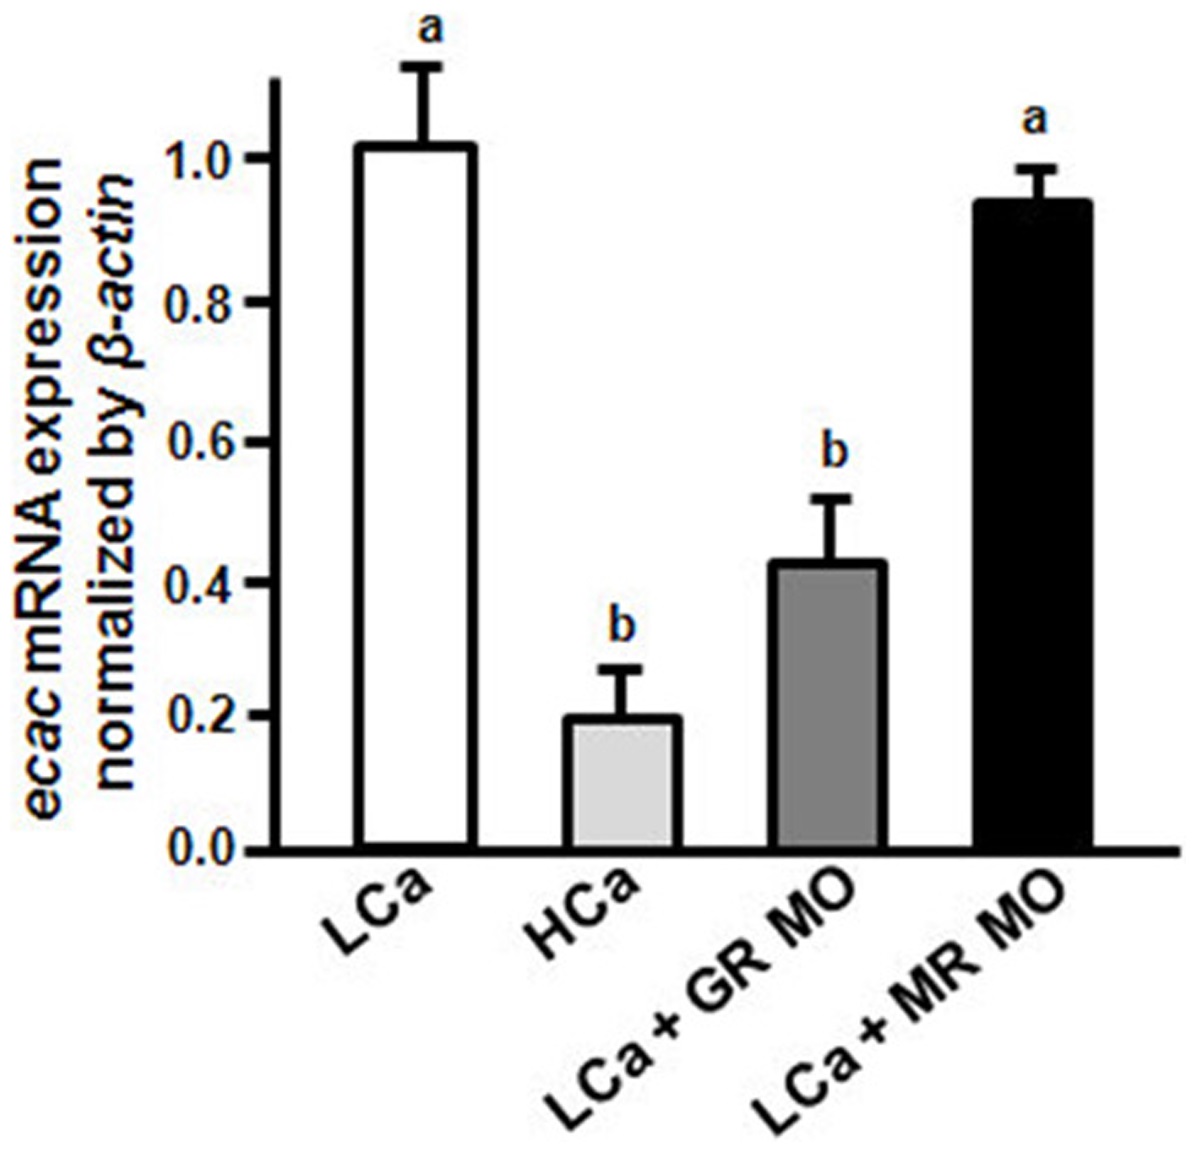
Fig. 10
Effect of MR MO and GR MO on ecac mRNA expression with low Ca2+ treatment.
ecac mRNA expression were analyzed in 3-dpf zebrafish embryos injected with GR MO or MR MO with low Ca2+ (0.02 mM; LCa) treatment. mRNA expressions were analyzed by qPCR, and values were normalized to β-actin. abcIndicate a significant difference (p<0.05) using Tukey′s multiple-comparison test following one-way ANOVA. Values are the mean ± SEM. (n = 6~8).
Acknowledgments
This image is the copyrighted work of the attributed author or publisher, and
ZFIN has permission only to display this image to its users.
Additional permissions should be obtained from the applicable author or publisher of the image.
Full text @ PLoS One