
Image
|
Figure Caption
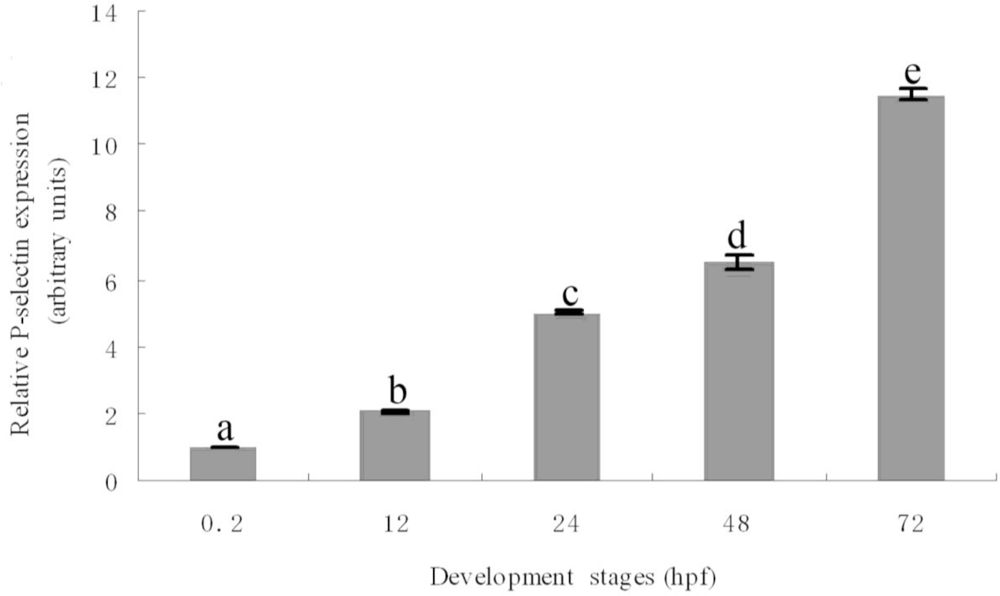
Fig. 4
Expression analysis of zebrafish P-selectin during embryo development by real-time quantitative PCR. Different letters indicate significant differences (p < 0.05).
Figure Data
Acknowledgments
This image is the copyrighted work of the attributed author or publisher, and
ZFIN has permission only to display this image to its users.
Additional permissions should be obtained from the applicable author or publisher of the image.
Open Access.
Full text @ Int. J. Mol. Sci.