
|
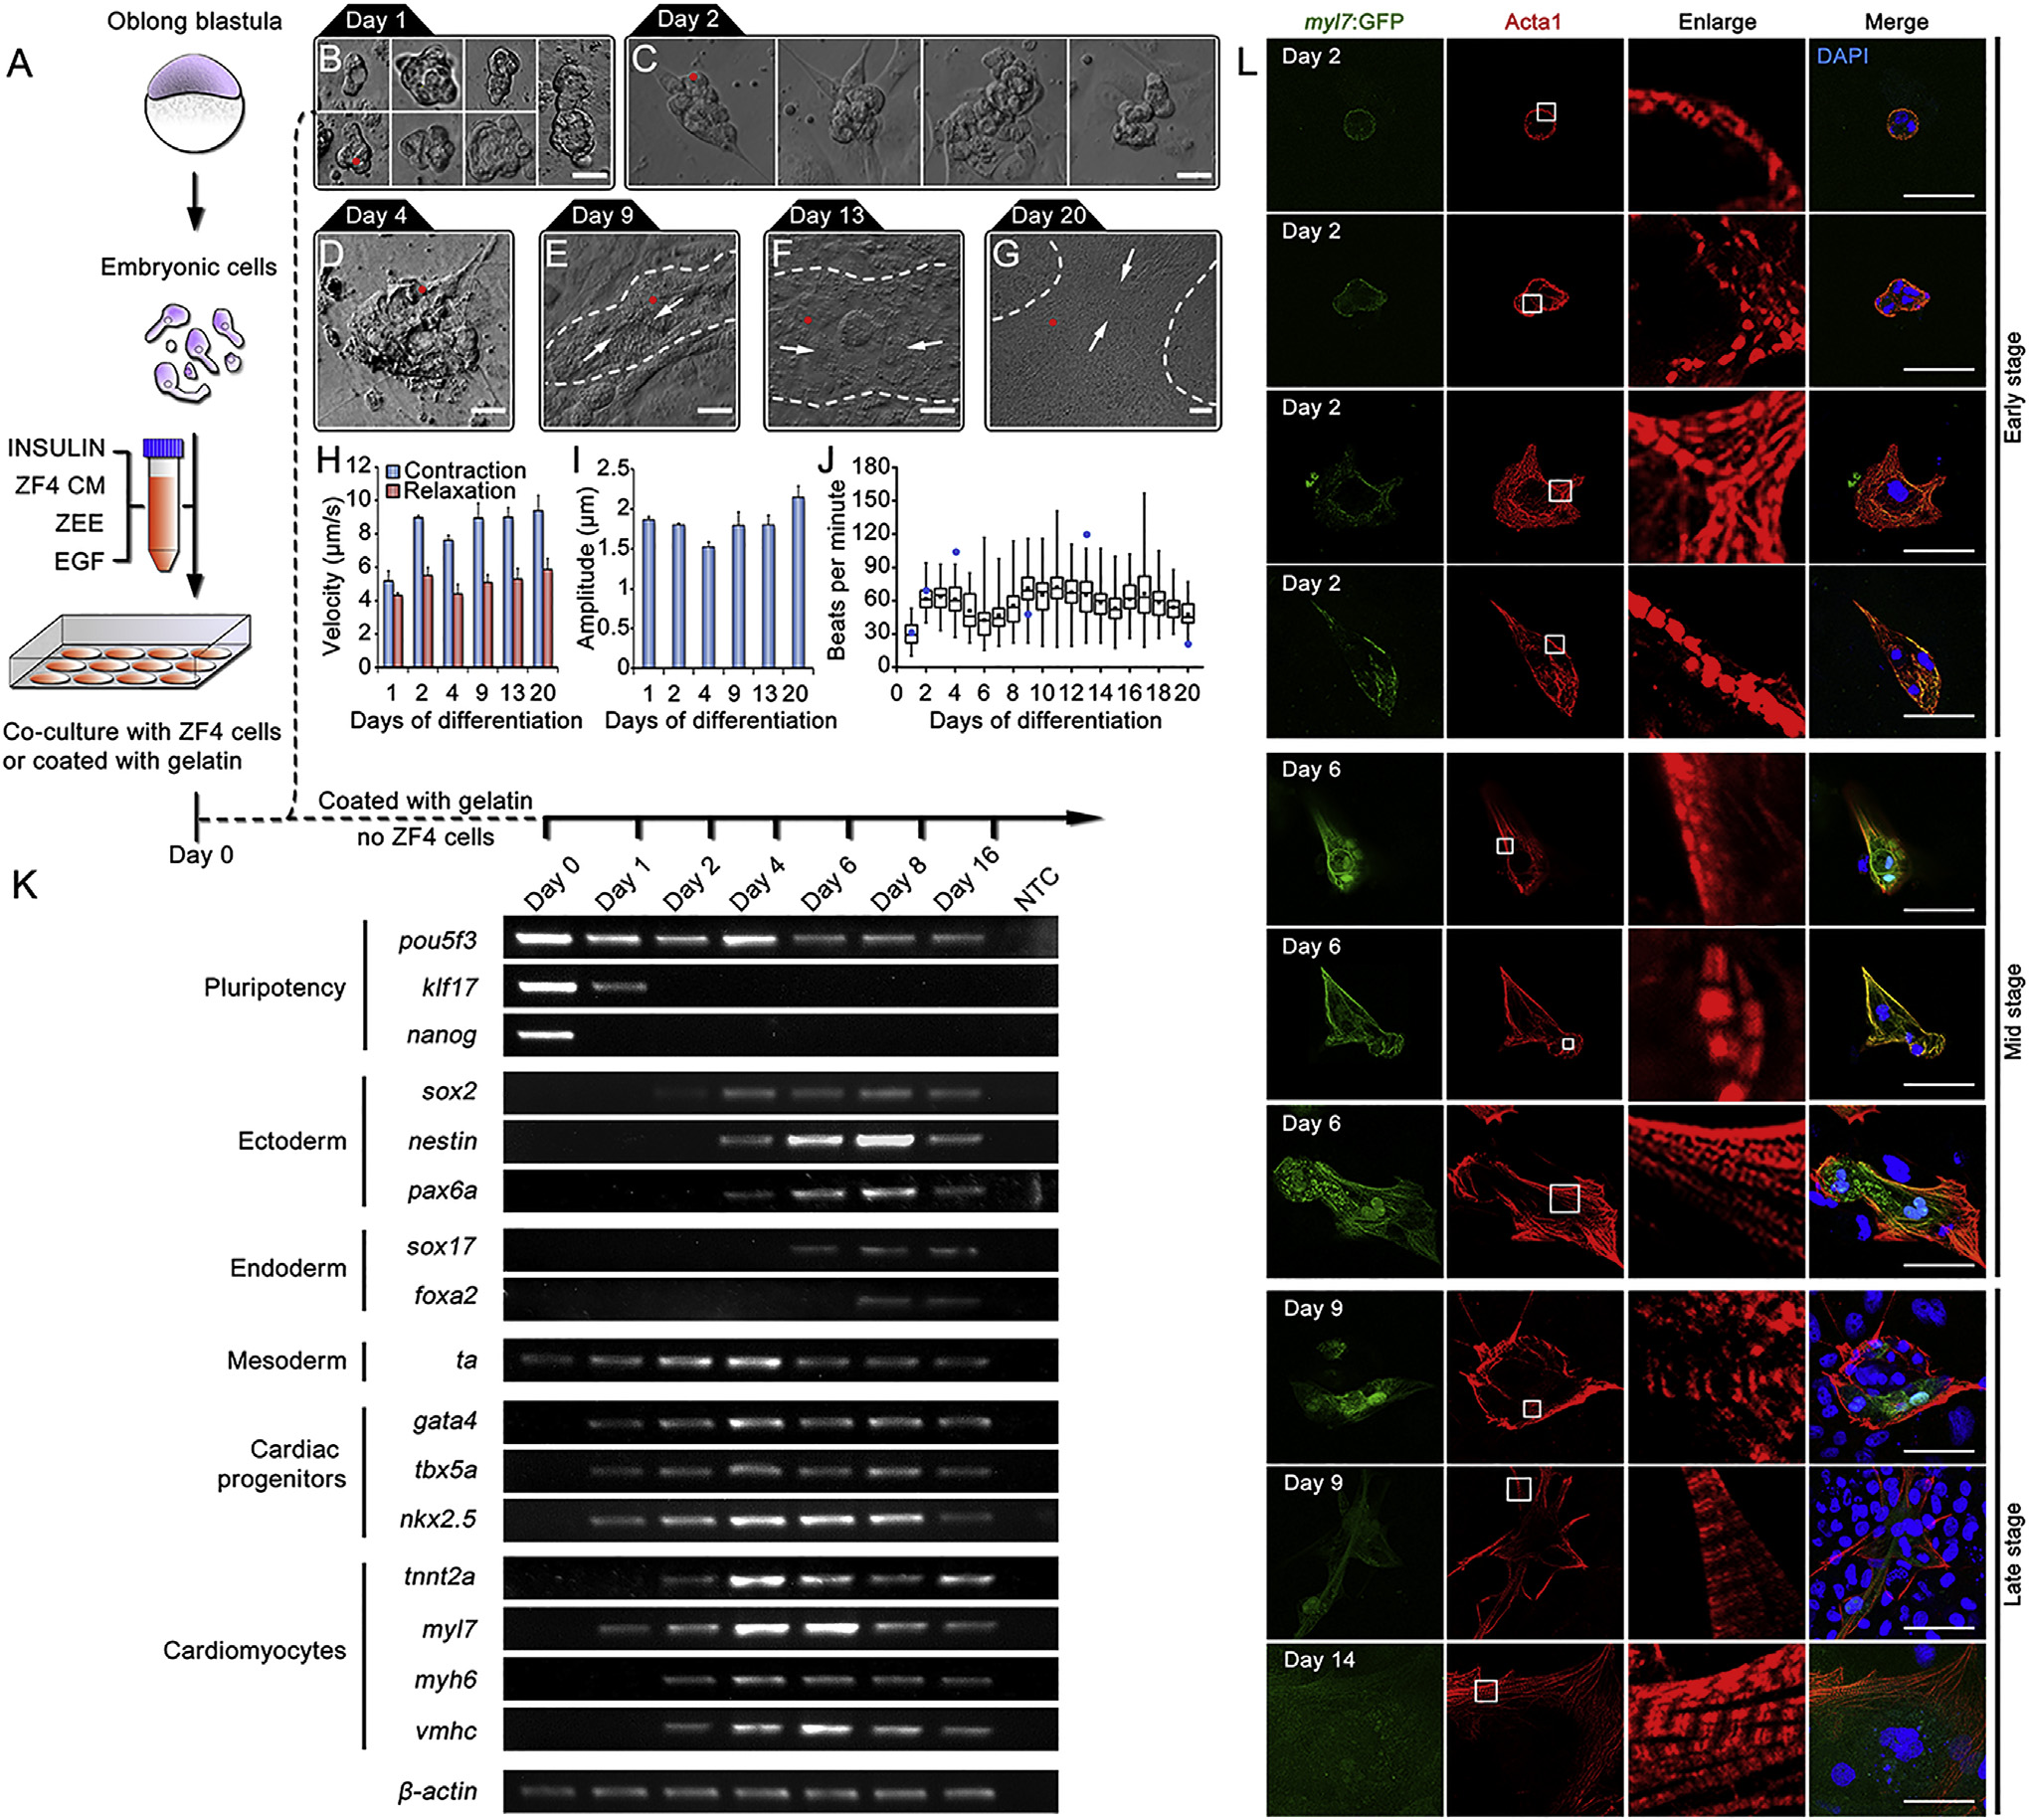
Fig. 3
Morphology and Beating Characteristics of BCCs Differentiated from Primary Embryonic Cells
(A) Schematic diagram of in vitro differentiation procedures.
(B-G) Morphology of BCCs at different days of differentiation when co-culturing with ZF4 cells. Dashed lines, contracting area; arrows, contracting directions; Red dots show the sites that were used for track analysis of BCC contractile kinetics in (H) and (I). Scale bar, 20 µm.
(H and I) Contraction and relaxation velocity (H) and contraction amplitudes (I) of BCCs at different days of differentiation. Three contractions of each BCC pointed by red dots in (B-G) were tracked. Data are shown as mean ± SEM.
(J) Beating rates of BCCs at day 1-20. Cells were cultured in gelatin-coated plates. Two independent experiments, n = 52-101 BCCs/group. Blue dots show the beating rates of the BCC in (B-G).
(K) Gene-expression analysis by RT-PCR during cardiomyocyte differentiation of primary embryonic cells. Primer sequences and PCR conditions are listed in Table S1. NTC, no template control.
(L) Cellular and molecular characteristics of Tg (myl7:EGFP) BCCs at different stages of differentiation. Early stage, day 2; middle stage, day 6; late stage, days 9 and 14. Cardiomyocytes marker, Myl7 (green); sarcomeres maker, α-skeletal actin (Acta1, red). Enlarged squares indicate the process of sarcomere formation during cardiomyocyte maturation. Nuclei were stained with DAPI (blue). Scale bars, 50 µm.