
Image
|
Figure Caption
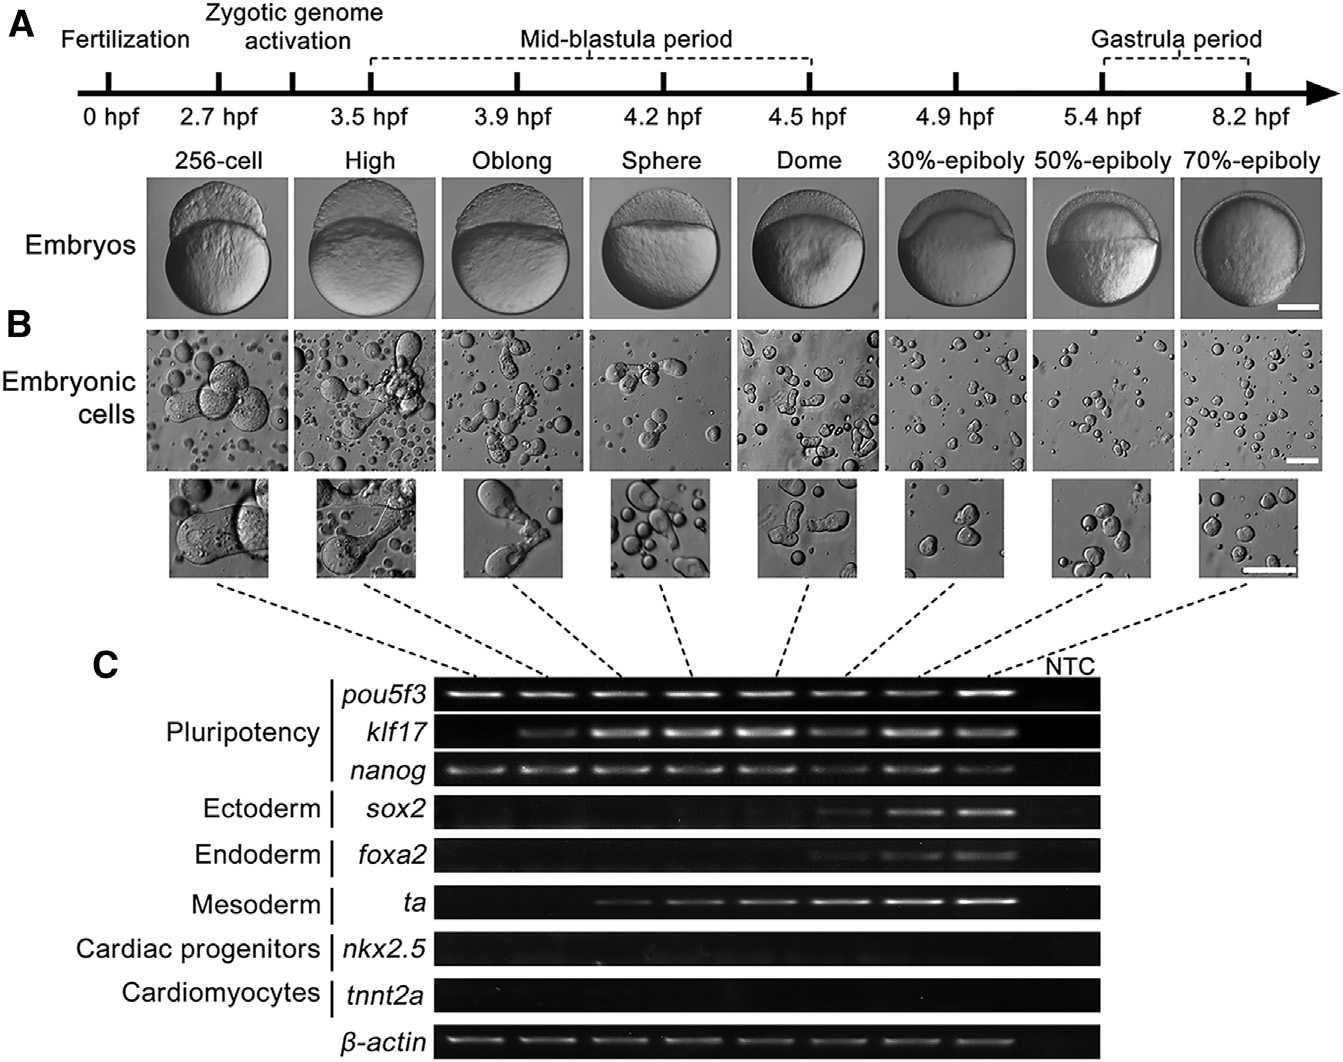
Fig. 1
Pluripotency Timing during Embryogenesis in Zebrafish
(A) Representative morphology of early embryos at 256-cell, high, oblong, sphere, dome, 30%-epiboly, 50%-epiboly, and 70%-epiboly stages. hpf, hours post fertilization. Scale bar, 250 µm.
(B) Morphology of isolated embryonic cells from different stages. Asymmetric spread of cytoplasm was observed in all stages (lower panel). Scale bar, 50 µm.
(C) RT-PCR analysis of gene expression patterns in different stages of the embryos. Primer sequences and PCR conditions are listed in Table S1. NTC, no template control.
Acknowledgments
This image is the copyrighted work of the attributed author or publisher, and
ZFIN has permission only to display this image to its users.
Additional permissions should be obtained from the applicable author or publisher of the image.
Full text @ Stem Cell Reports