
Fig. S3
- ID
- ZDB-IMAGE-161018-8
- Publication
- Lu et al., 2016 - IGFBP1 increases β-cell regeneration by promoting α- to β-cell transdifferentiation
- All Figures
- Figures for Lu et al., 2016
|
Fig. S3
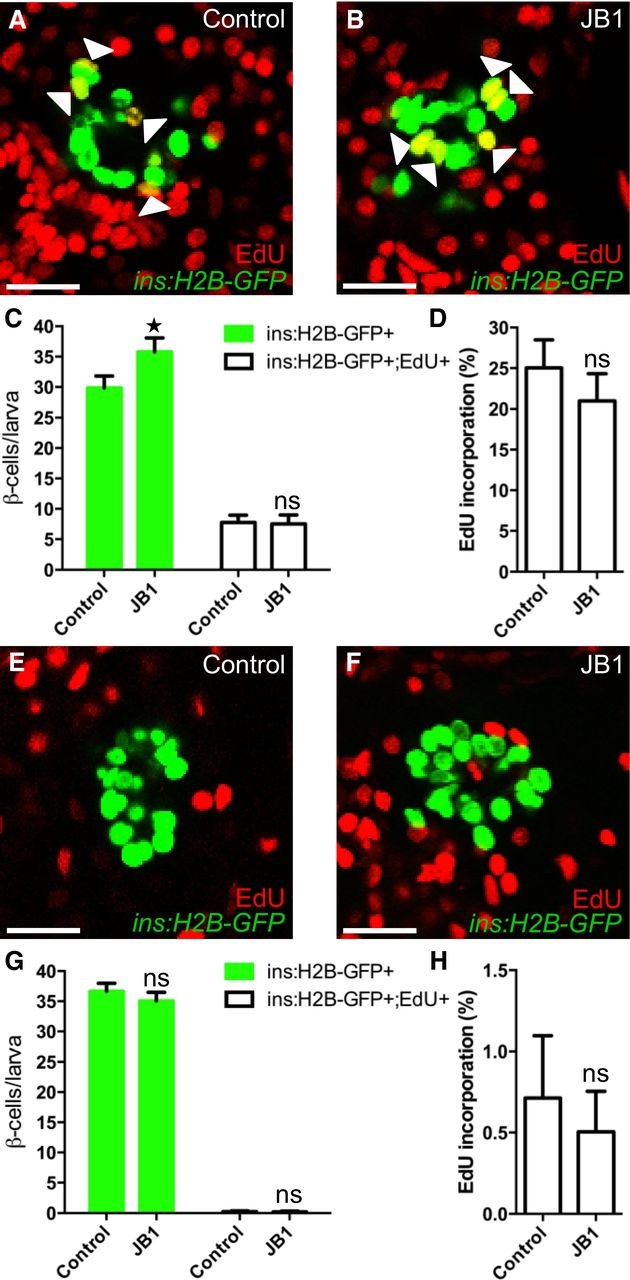
The IGF1R inhibitor JB1 promotes βcell regeneration
A-D. Tg(ins:H2BGFP);Tg(ins:FlagNTR) larvae were treated with MTZ from 3 to 4 dpf to ablate the β cells. DMSO or JB1 was then injected into the larval pericardial cavity at 4 dpf, and the larvae were treated with EdU from 4 to 6 dpf. Representative confocal images (A, B) at 6 dpf of DMSO and JB1injected larvae, showing β cells in green and the β cells that incorporated EdU as yellow (green and red overlap; see arrowheads). Scale bars: 20 µm. (C) Quantification of the number of all β cells (green bars) and of β cells that incorporated EdU (white bars) per larva at 6 dpf. *P = 0.0422; ns=nonsignificant (P = 0.9944). (D) Rate of βcell proliferation, shown as the percentage of β cells that incorporated EdU. ns=nonsignificant (P = 0.5885). n = 12 larvae in the DMSOinjected group; n = 19 larvae in the JB1injected group.
E-H. To determine whether inhibition of Igf signaling affects βcell proliferation during regular development, we treated DMSO or JB1injected Tg(ins:H2BGFP) larvae with EdU in the absence of βcell ablation. DMSO or JB1 was injected into pericardial cavity of Tg(ins:H2BGFP) larvae at 4 dpf, and the larvae were then treated with EdU from 4 to 6 dpf. Representative confocal images (E, F) at 6 dpf of DMSO and JB1injected larvae, showing β cells in green and the cells that incorporated EdU in red. Scale bars: 20 µm. (G) Quantification of the number of all β cells (green bars) and of β cells that incorporated EdU (white bars) from 4 to 6 dpf. ns=nonsignificant (P = 0.4088 and 0.9997, respectively). (H) Rate of βcell proliferation, shown as the percentage of β cells that incorporated EdU. P = 0.8504. n = 20 larvae in the DMSOinjected group, n = 27 larvae in the JB1injected group.