
Fig. S4
- ID
- ZDB-IMAGE-161018-30
- Antibodies
- Publication
- Olsen et al., 2016 - G9a and ZNF644 Physically Associate to Suppress Progenitor Gene Expression during Neurogenesis
- All Figures
- Figures for Olsen et al., 2016
|
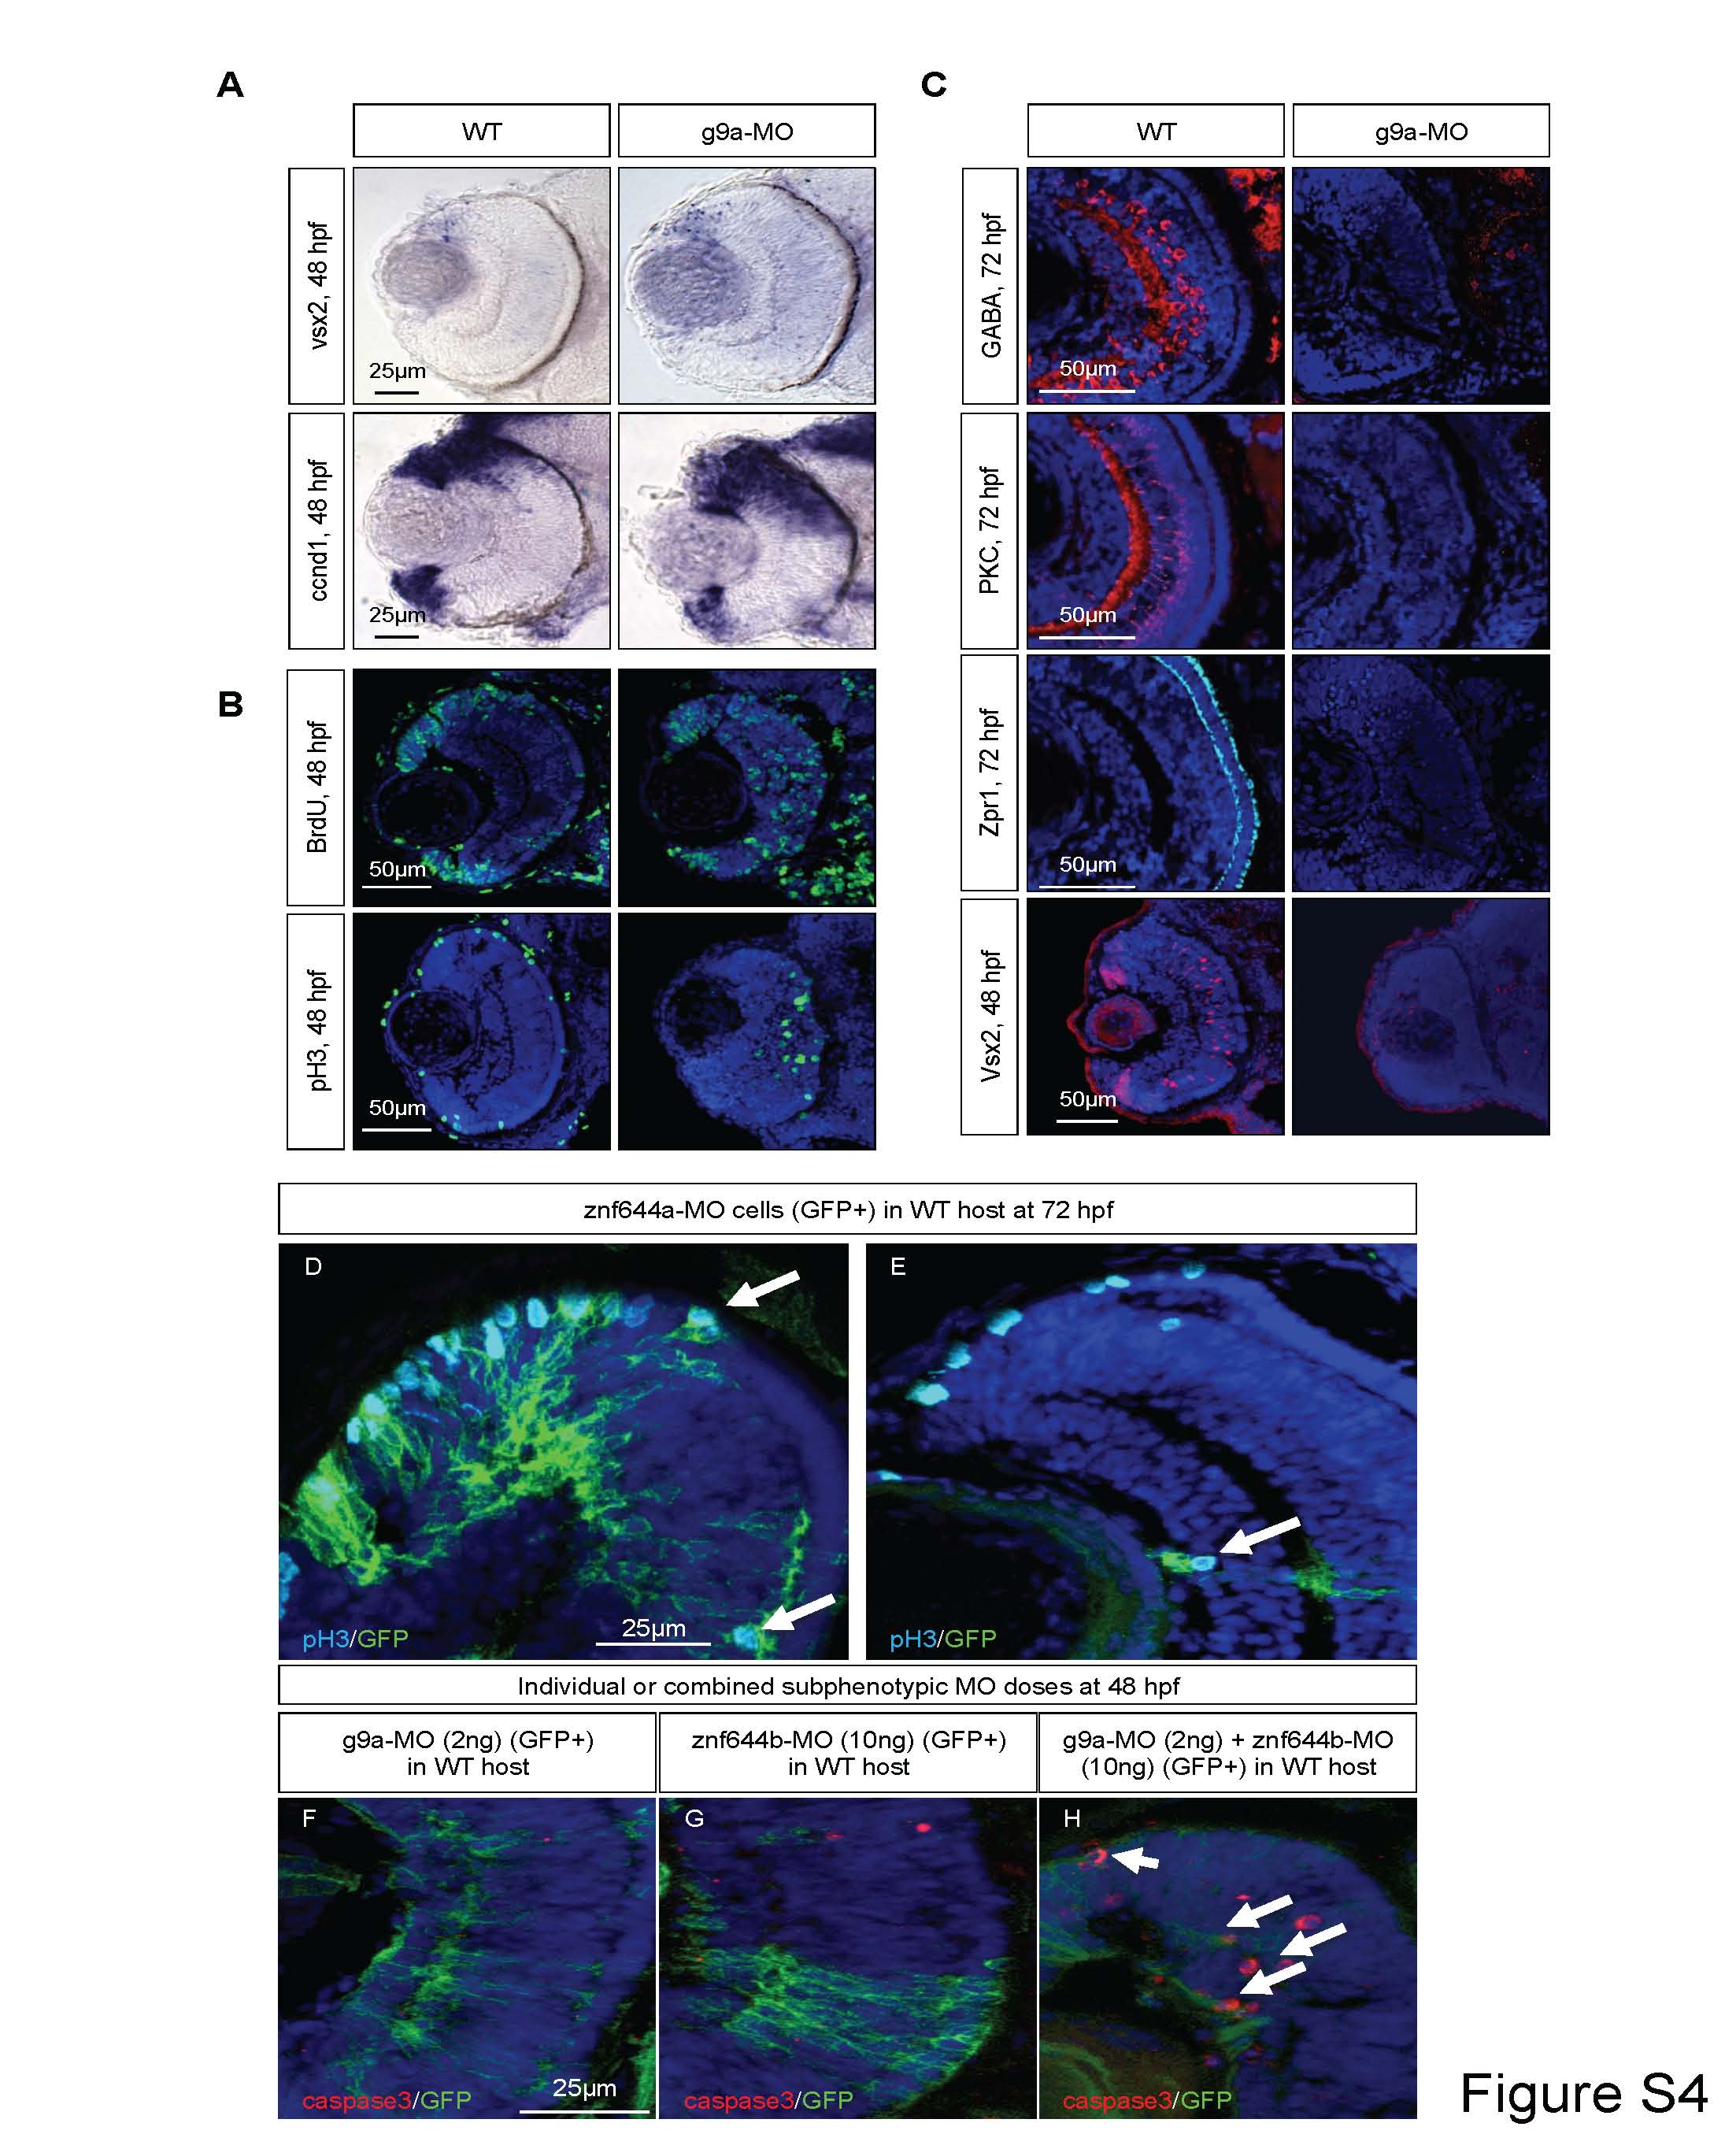
Fig. S4
Top: (A) WISH assays monitoring the expression of vsx2 or ccnd1 at 48 hpf in WT or g9a morphant retinal cross-sections. (B) Immunostaining assays monitoring BrdU- or pH3-postive cells at 48 hpf in WT or g9a morphant retinal cross-sections. (C) Immunostaining assays monitoring the expression of the indicated neuronal markers in g9a morphant retinal cross-sections at the indicated time points. Bottom: Blastula cell transplantation experiments (n=3 separate experiments) of donor morphant cells to wildtype host cells. All transplanted embryos were screened at 24 hpf and only those embryos with GFP+ contribution to the retina were further analyzed. (D-E) Only 2 out of 30 positively screened transplanted embryos contained GFP+ znf644a-MO cells within the retina at 72 hpf. (D) One embryo demonstrated a relatively large population of GFP+ morphant cells near the retinal periphery, which is more permissive for proliferation. Many donor cells at the periphery were also pH3+, and donor morphant cells located at the central retina were also proliferating ectopically (arrows). (E) The other embryo had very few cells in the center retina, but still showed evidence of ectopic proliferation (arrow). In both instances, host central retinal cells were not induced to proliferate. (F) Subphenotypic dose of GFP+ g9a-MO in donor cells does not lead to cell death after transplantation. (G) Subphenotypic dose of GFP+ znf644b-MO in donor cells does not lead to cell death after transplantation. (H) Combined subphenotypic doses of GFP+ g9a- MO and znf644a-MO results in donor cells undergoing cell death (caspase3+) that is confined to the donor cells. In each experiment, n>10 embryos were screened as GFP+ at 24 hpf, and n=3 were sectioned for analysis in each group at 48 hpf. Representative images of sections are shown. The WT ccnd1 (48 hpf) image in Figure S4A are re-used from Figure 3D; the WT BrdU (48 hpf) in Figure S4B is re-used from Figure 4A; the WT GABA, PKC and Zpr1 (72 hpf) images in Figure S4C are re-used from Figure 4F; and the WT vsx2 (48 hpf) images in Figure S4C are re-used from Figure 5A.