
Fig. 6
- ID
- ZDB-IMAGE-161018-14
- Publication
- D'Orazi et al., 2016 - Mismatch of Synaptic Patterns between Neurons Produced in Regeneration and during Development of the Vertebrate Retina
- All Figures
- Figures for D'Orazi et al., 2016
|
Fig. 6
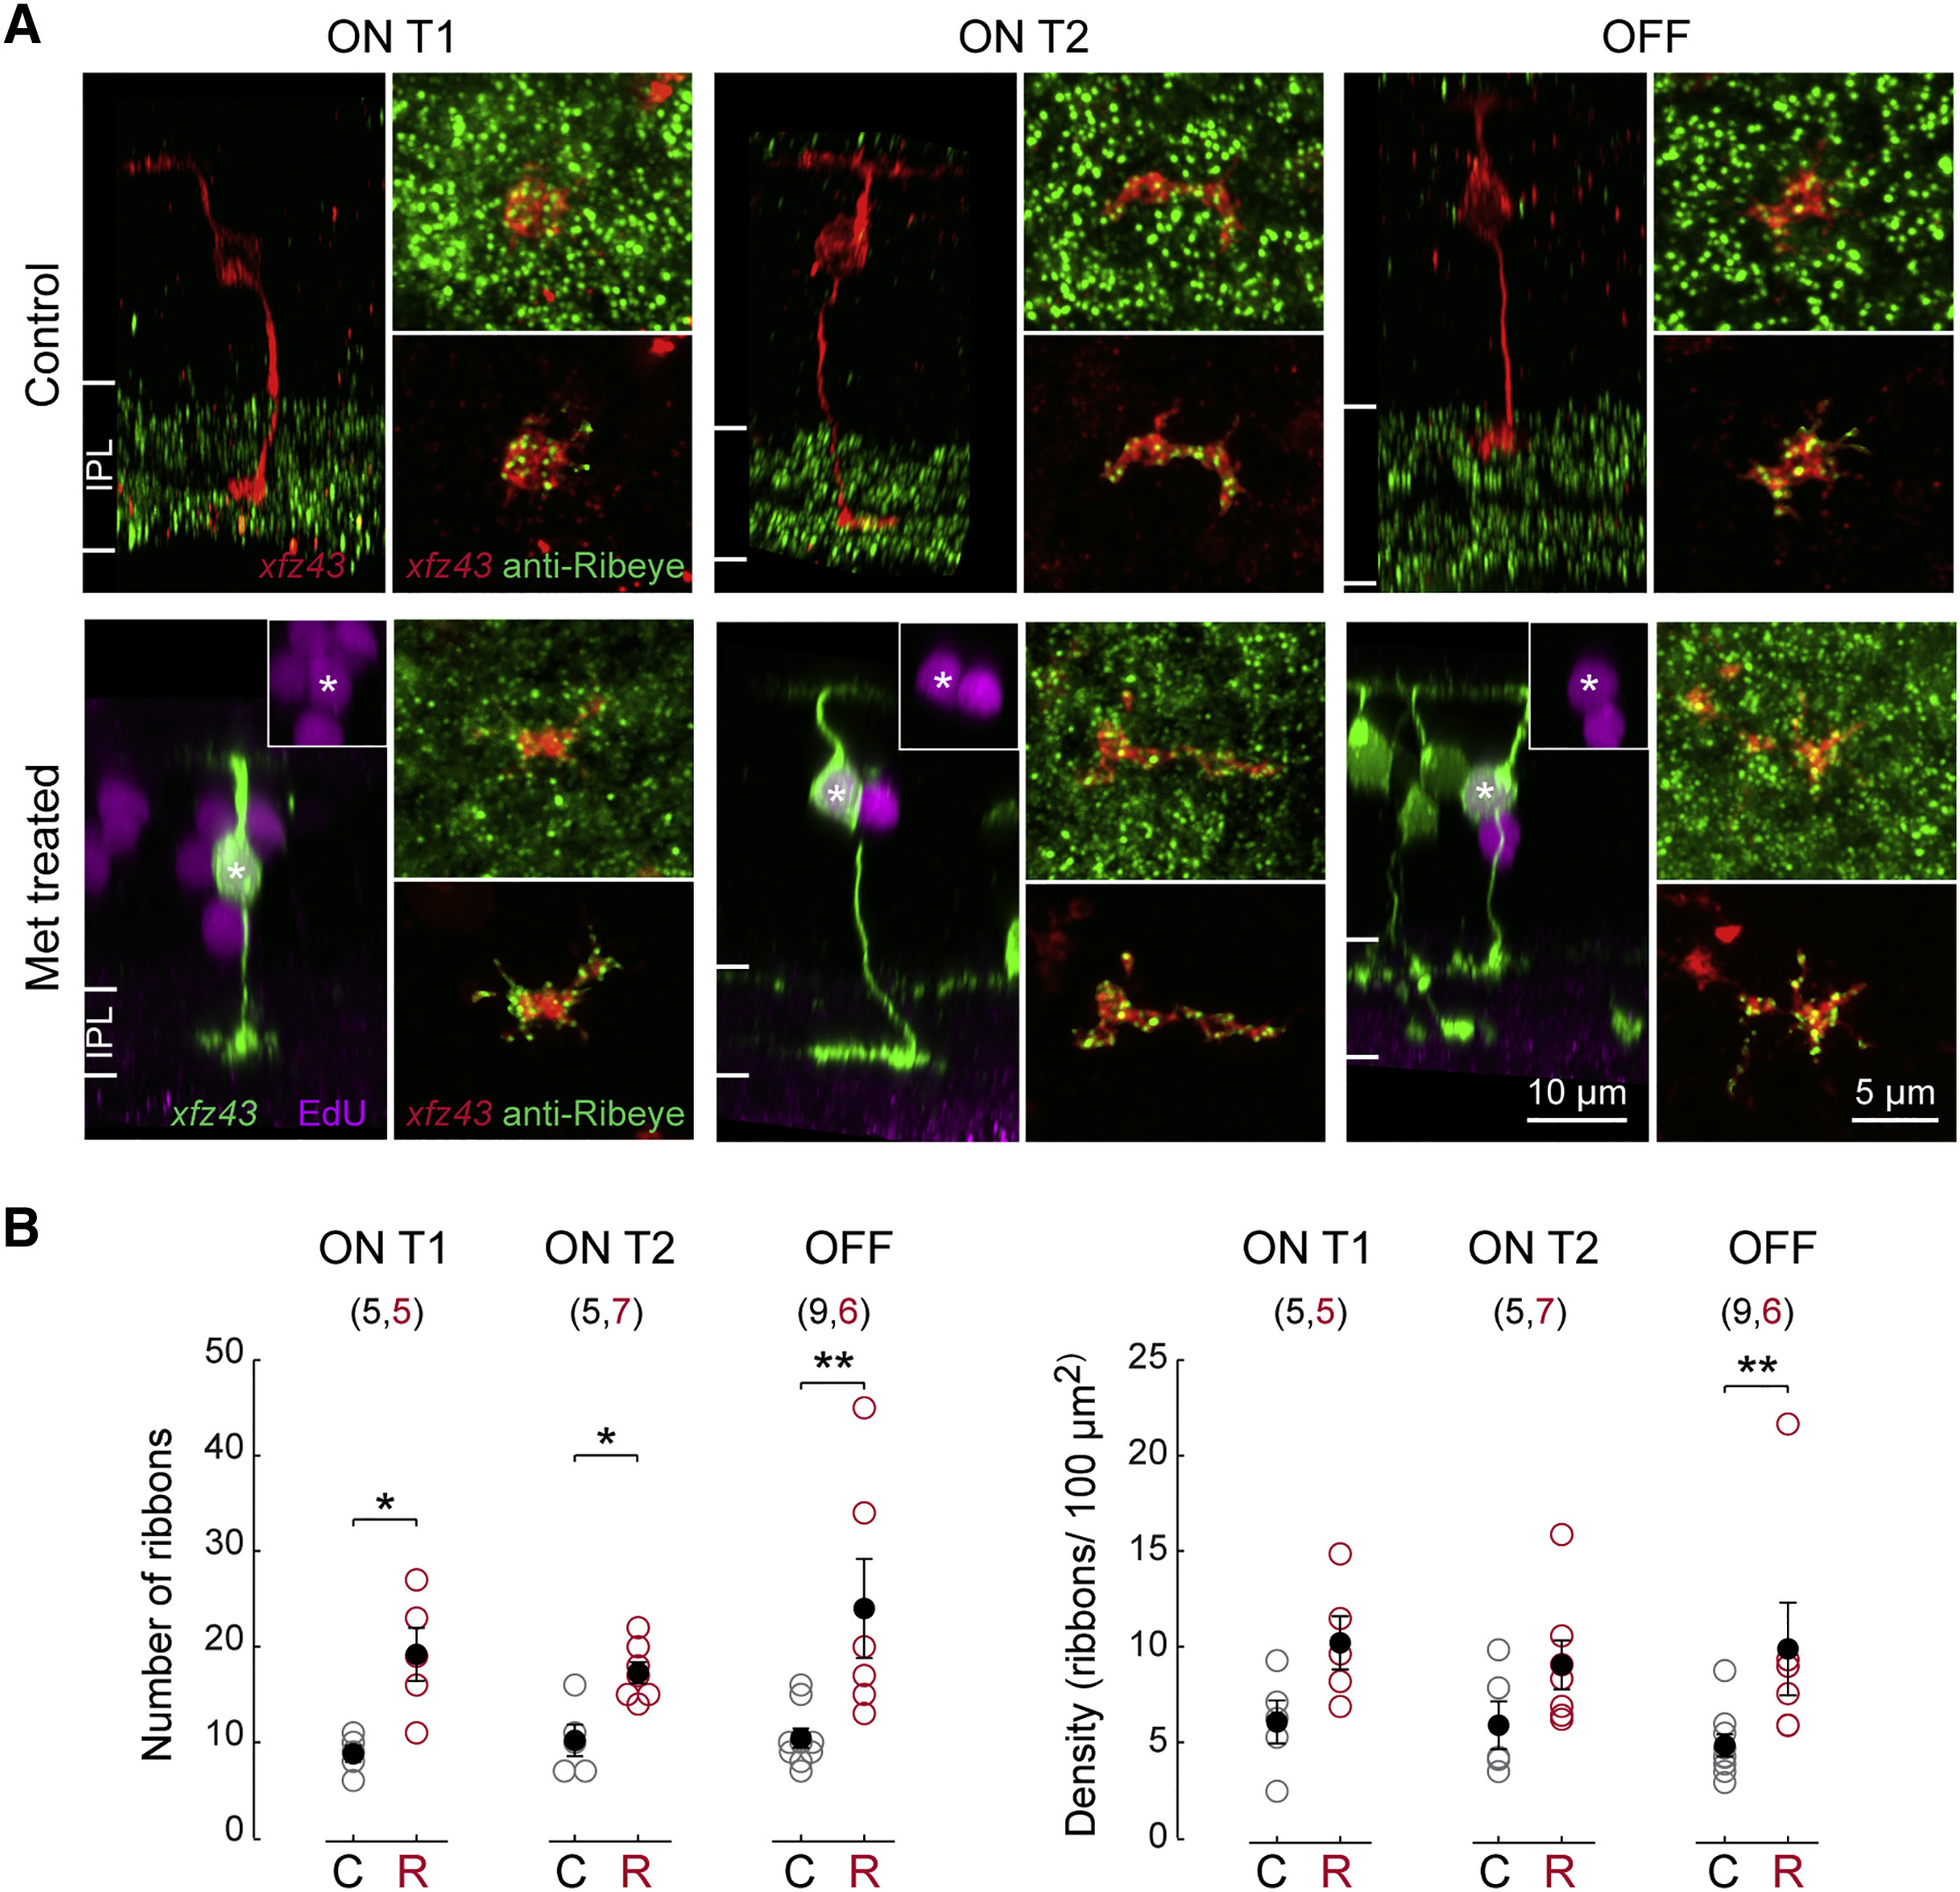
Regenerated BCs Form Excess Ribbon Synapses in the IPL
(A) Examples of individual ON T1, ON T2, and OFF BCs visualized together with Ribeye A immunolabeling in fixed tissue from control or Met-treated larvae at 20 dpf (13 dpa). The Ribeye A antibody produced the expected staining pattern, showing punctate labeling within the IPL. Individual BCs in control tissue were visualized by DNA plasmid injection. Regenerated BCs in Met-treated tissue were identified by NTR-mCherry expression and EdU incorporation. En face views of axon terminal synapses labeled with anti-Ribeye A. A volumetric mask of the xfz43 FP signal was used for visualization of ribbon synapses within an BC individual terminal (bottom panel).
(B) Comparisons of the mean number and density of Ribeye A puncta on xfz43 BC axon terminals of regenerated (R, red) BCs with counts from BCs in control (C, gray) tissue.
Open circles represent individual cells, with the number of cells analyzed shown in parentheses. Error bars, ±SEM. *p < 0.05, **p < 0.01; Wilcoxon-Mann-Whitney rank-sum test. All measurements were made in 20 dpf (13 dpa) larvae.