
Fig. 2
- ID
- ZDB-IMAGE-161018-10
- Publication
- D'Orazi et al., 2016 - Mismatch of Synaptic Patterns between Neurons Produced in Regeneration and during Development of the Vertebrate Retina
- All Figures
- Figures for D'Orazi et al., 2016
|
Fig. 2
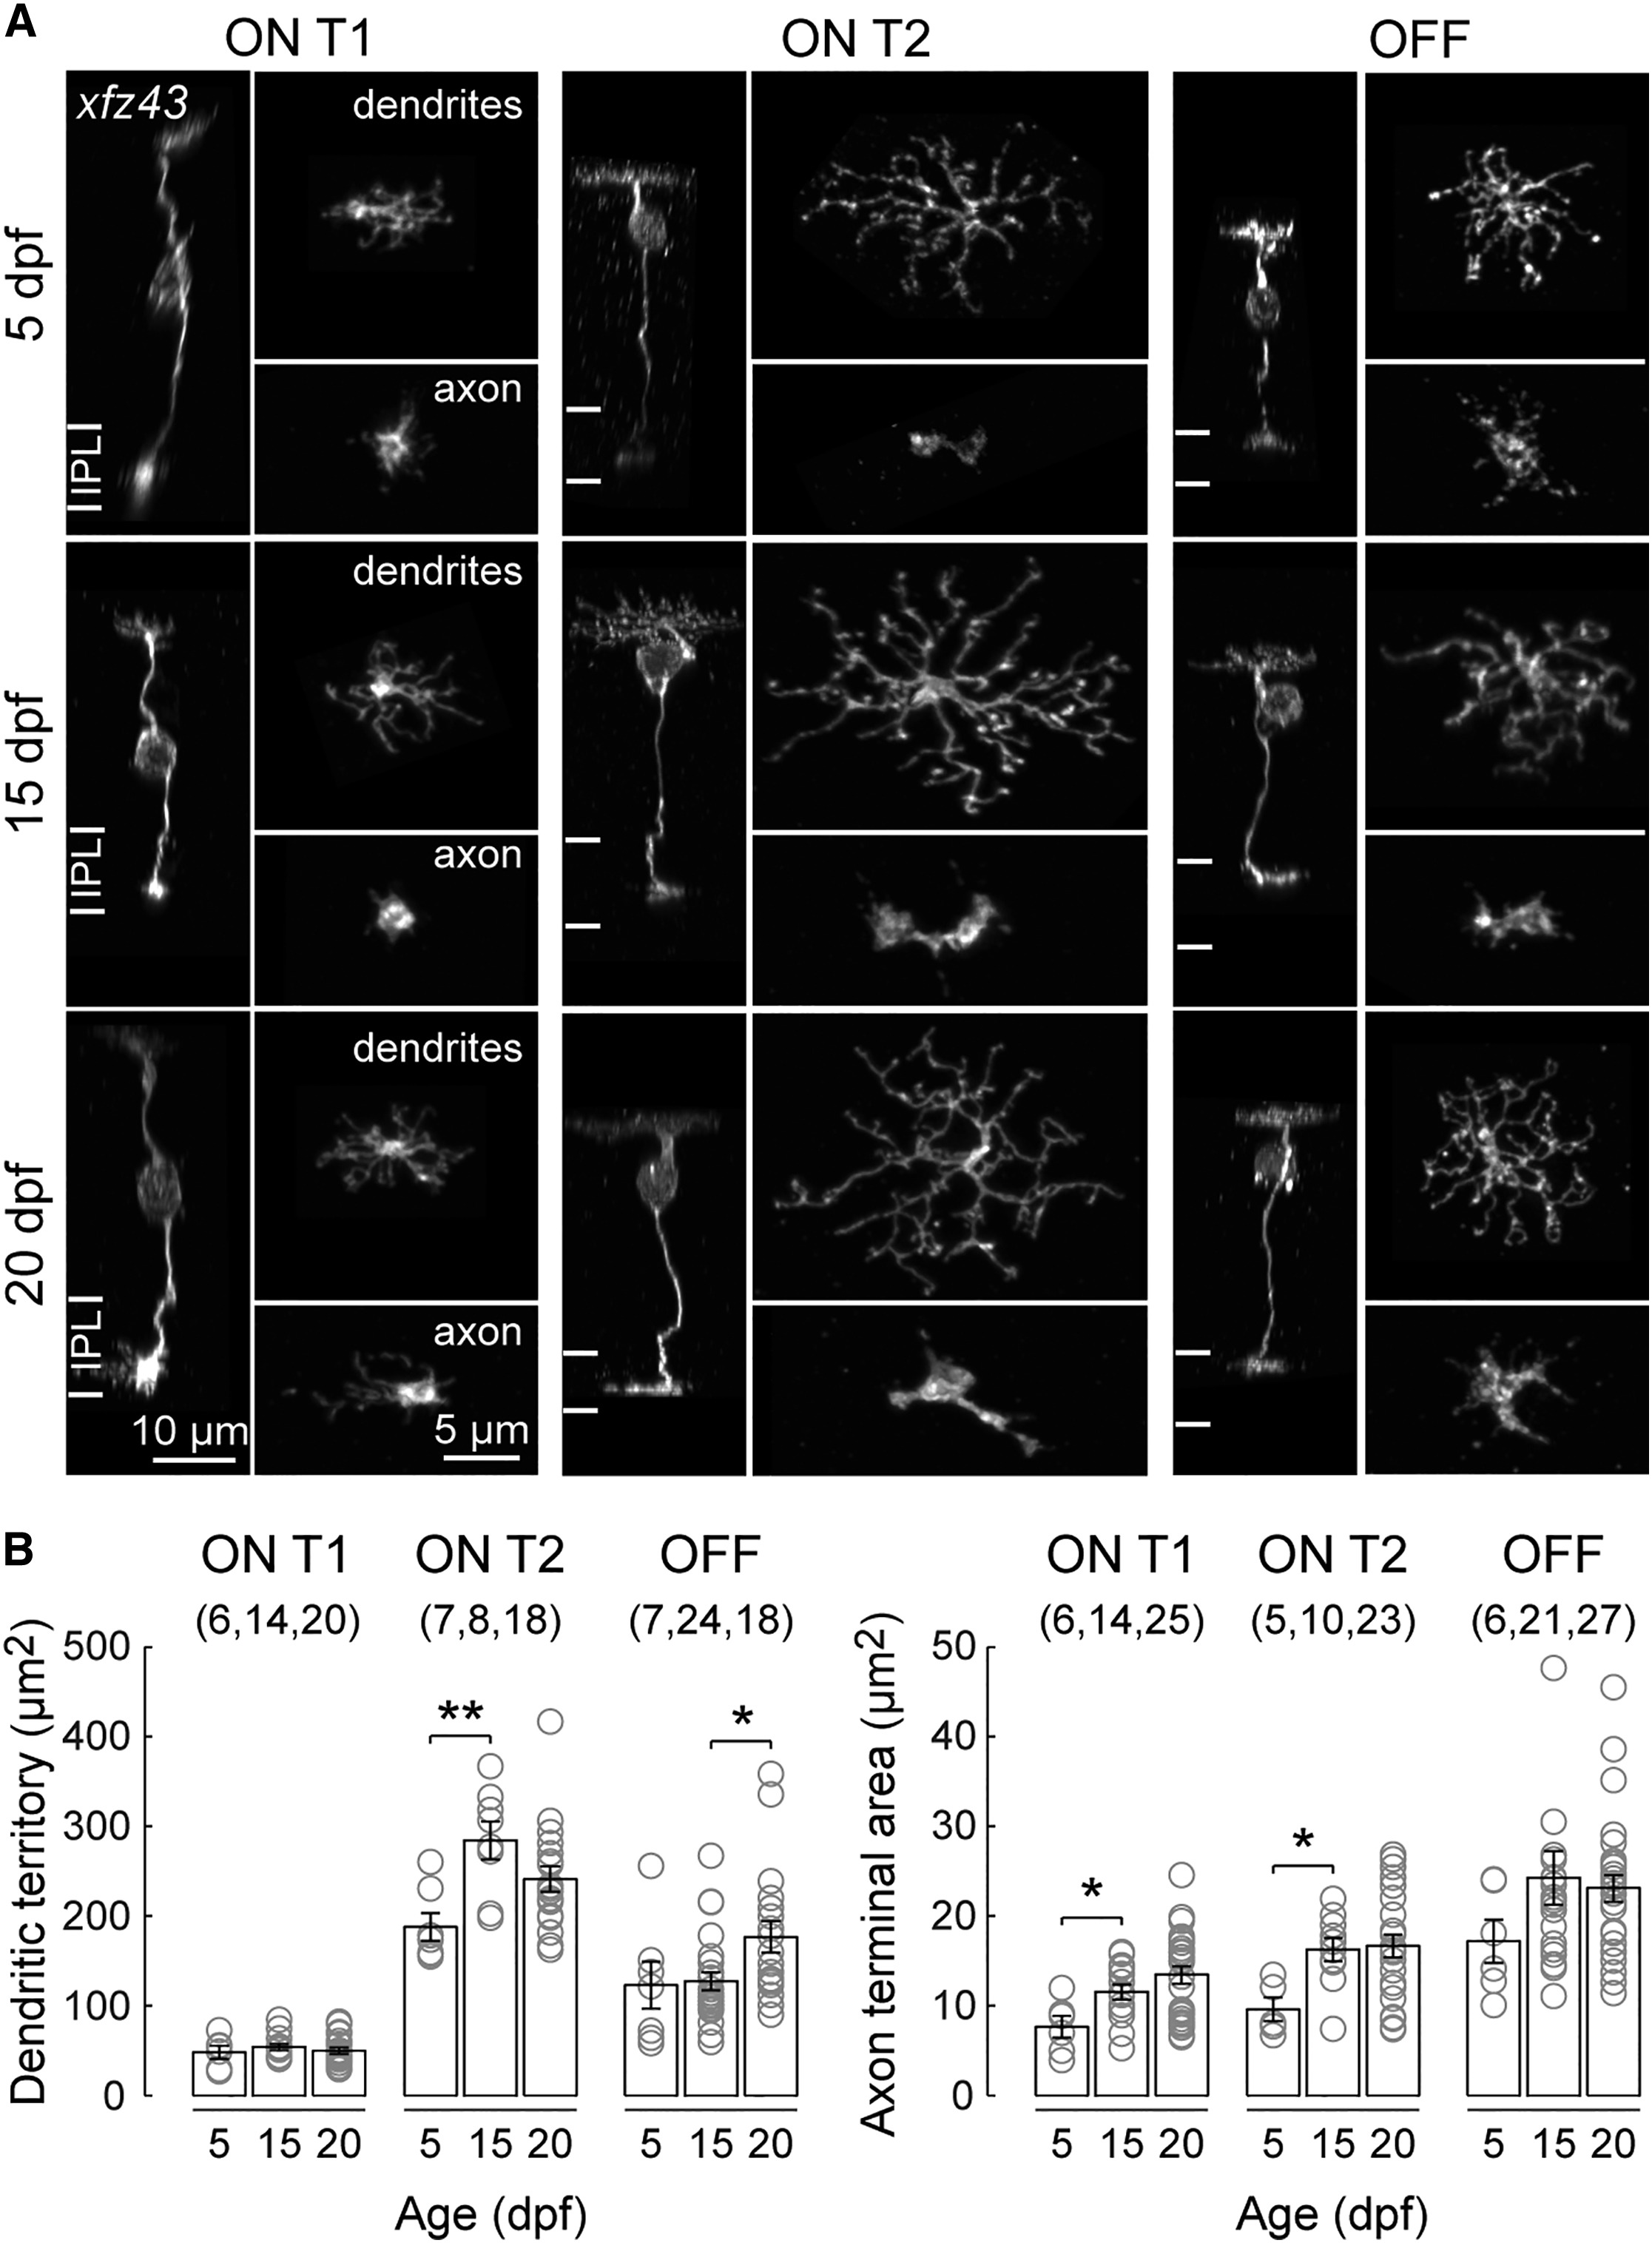
The Neurites of xfz43 BCs Grow without Remodeling during Maturation
(A) Representative ON T1, ON T2, and OFF xfz43 BCs visualized in fixed retinal tissue at 5, 15, and 20 dpf. BCs were classified based on a combination of dendritic territory and axon stratification measures. Side views of whole BCs, en face views of dendritic arbors and axon terminals.
(B) Plots across ages of the mean dendritic territory sizes and axon terminal areas for each xfz43 BC type.
Each open circle represents one cell, with the number of cells analyzed in parentheses. Error bars, ±SEM. *p < 0.05, **p < 0.01; Wilcoxon-Mann-Whitney rank-sum test.