
Fig. 1
- ID
- ZDB-IMAGE-160929-1
- Publication
- Park et al., 2016 - Loss of Ewing sarcoma EWS allele promotes tumorigenesis by inducing chromosomal instability in zebrafish
- All Figures
- Figures for Park et al., 2016
|
Fig. 1
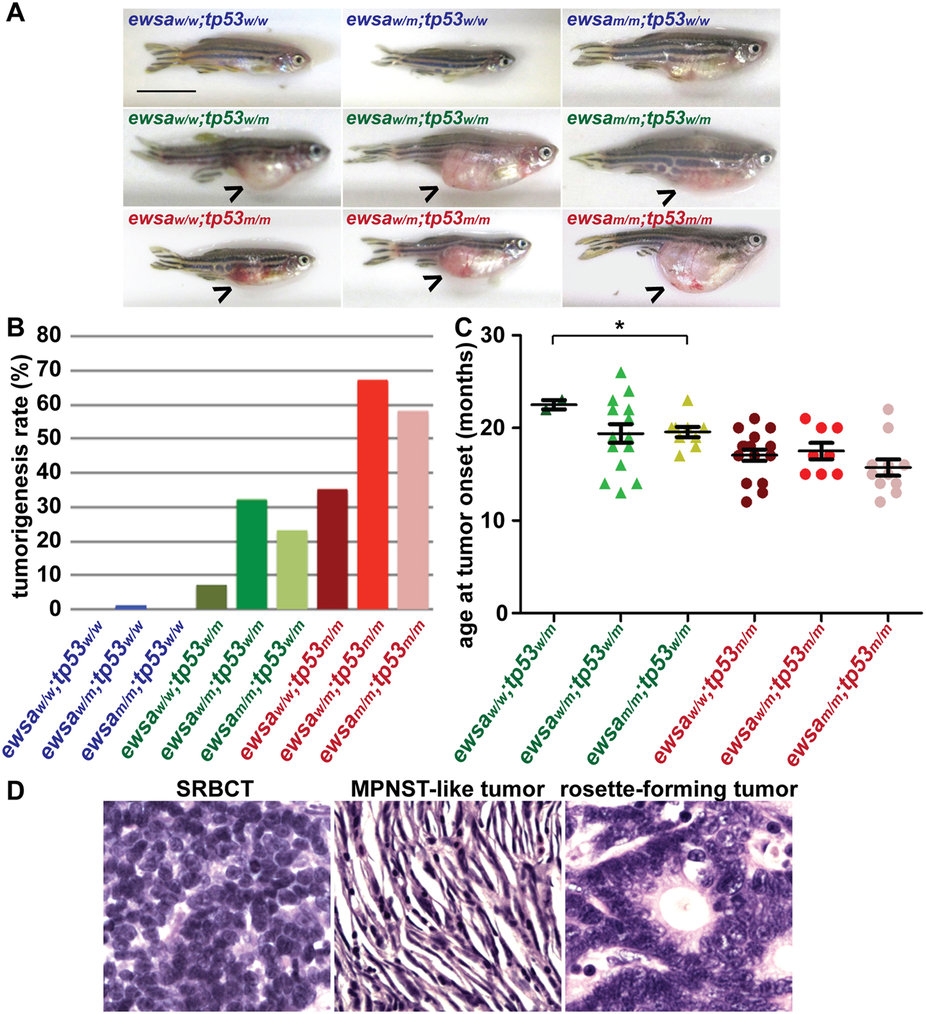
Loss of ewsa promotes tumorigenesis.
Total numbers of fish for each genotypes are: ewsaw/w;tp53w/w (n = 41), ewsaw/m;tp53w/w (n = 135), ewsam/m;tp53w/w (n = 21), ewsaw/w;tp53w/m (n = 28), ewsaw/m;tp53w/m (n = 46), ewsam/m;tp53w/m (n = 39), ewsaw/w;tp53m/m (n = 48), ewsaw/m;tp53m/m (n = 12), ewsam/m;tp53m/m (n = 19). (A) Representative images of zebrafish. In images of ewsa and tp53mutants, tumors are indicated with an arrow (>). Scale bar: 1cm. (B) Tumor incidence is higher in ewsaw/m;tp53w/m and ewsam/m;tp53w/m compared to ewsaw/w;tp53w/m; and in ewsaw/m;tp53m/m and ewsam/m;tp53m/m compared to ewsaw/w;tp53m/m zebrafish. (C) Average age at tumor onset is lower in ewsaw/m;tp53w/m and ewsam/m;tp53tp53w/m compared to ewsaw/w;tp53w/m; and in ewsaw/m;tp53m/m and ewsam/m;tp53m/m compared to ewsaw/w;tp53m/m zebrafish. (D) Representative images of H&E staining of tumors observed in zebrafish. MPNST-like: malignant peripheral nerve sheath tumor-like; SRBCT: small round blue cell tumor.